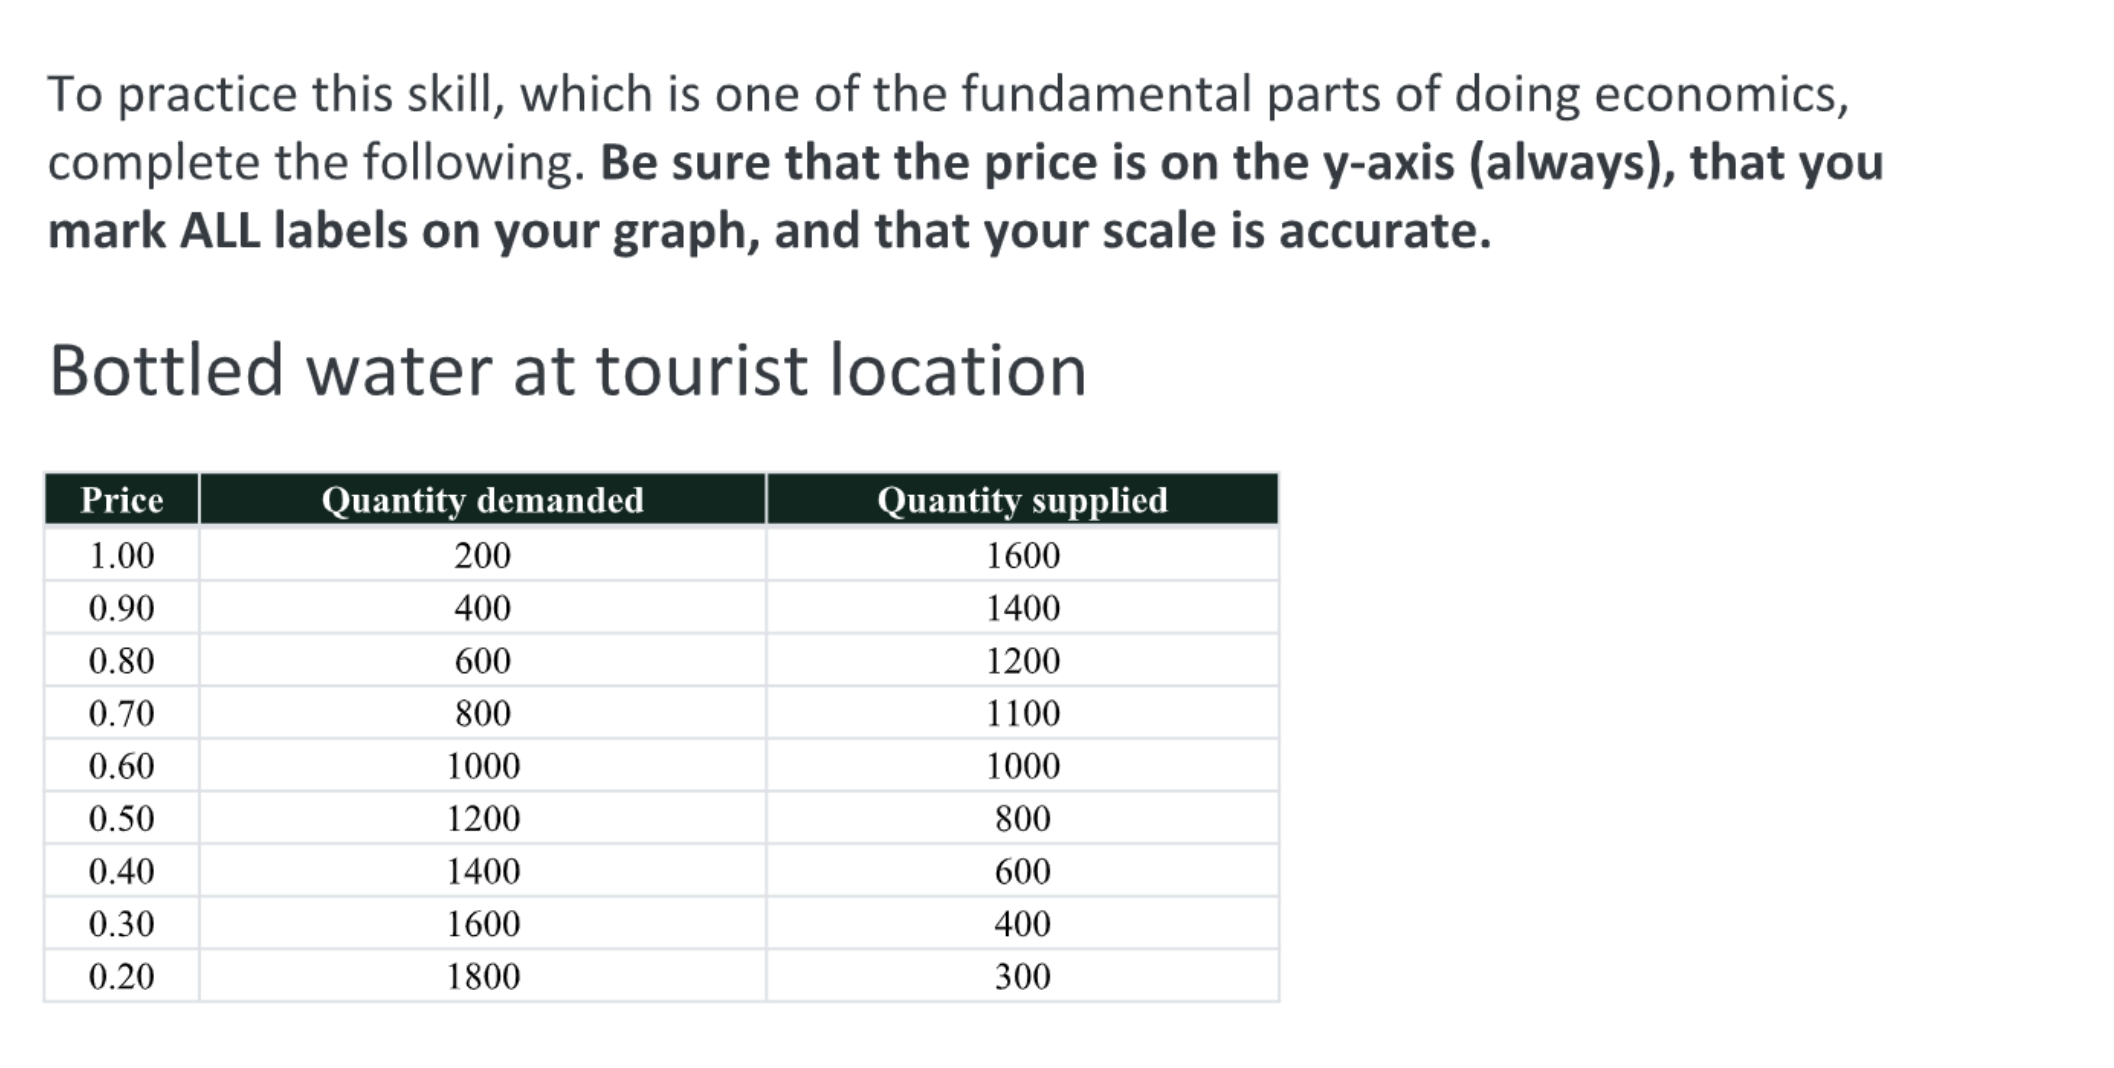
To practice this skill, which is one of the fundamental parts of doing economics, complete the following. Be sure that the price is on the y-axis (always), that you mark ALL labels... To practice this skill, which is one of the fundamental parts of doing economics, complete the following. Be sure that the price is on the y-axis (always), that you mark ALL labels on your graph, and that your scale is accurate.

Understand the Problem
The question is asking to complete a task related to graphing economics data where you plot the price of bottled water against quantity demanded and supplied, ensuring that the price is on the y-axis.
Answer
Plot demand and supply curves with price on the y-axis.
To practice this skill, ensure you plot price on the y-axis, accurately scale the quantity on the x-axis, plot demand and supply curves, label all points, and provide a clear graph.
Answer for screen readers
To practice this skill, ensure you plot price on the y-axis, accurately scale the quantity on the x-axis, plot demand and supply curves, label all points, and provide a clear graph.
More Information
Graphing demand and supply curves helps visualize how price and quantity interact in a market, allowing for analysis of equilibrium points.
Tips
A common mistake is to improperly scale the axes or forget to label curves and axes, leading to a confusing or inaccurate graph.
Sources
- Demand Curves: What Are They, Types, and Example - Investopedia - investopedia.com
- [PDF] Graphing-Packet Answers.pdf - woboe.org
AI-generated content may contain errors. Please verify critical information