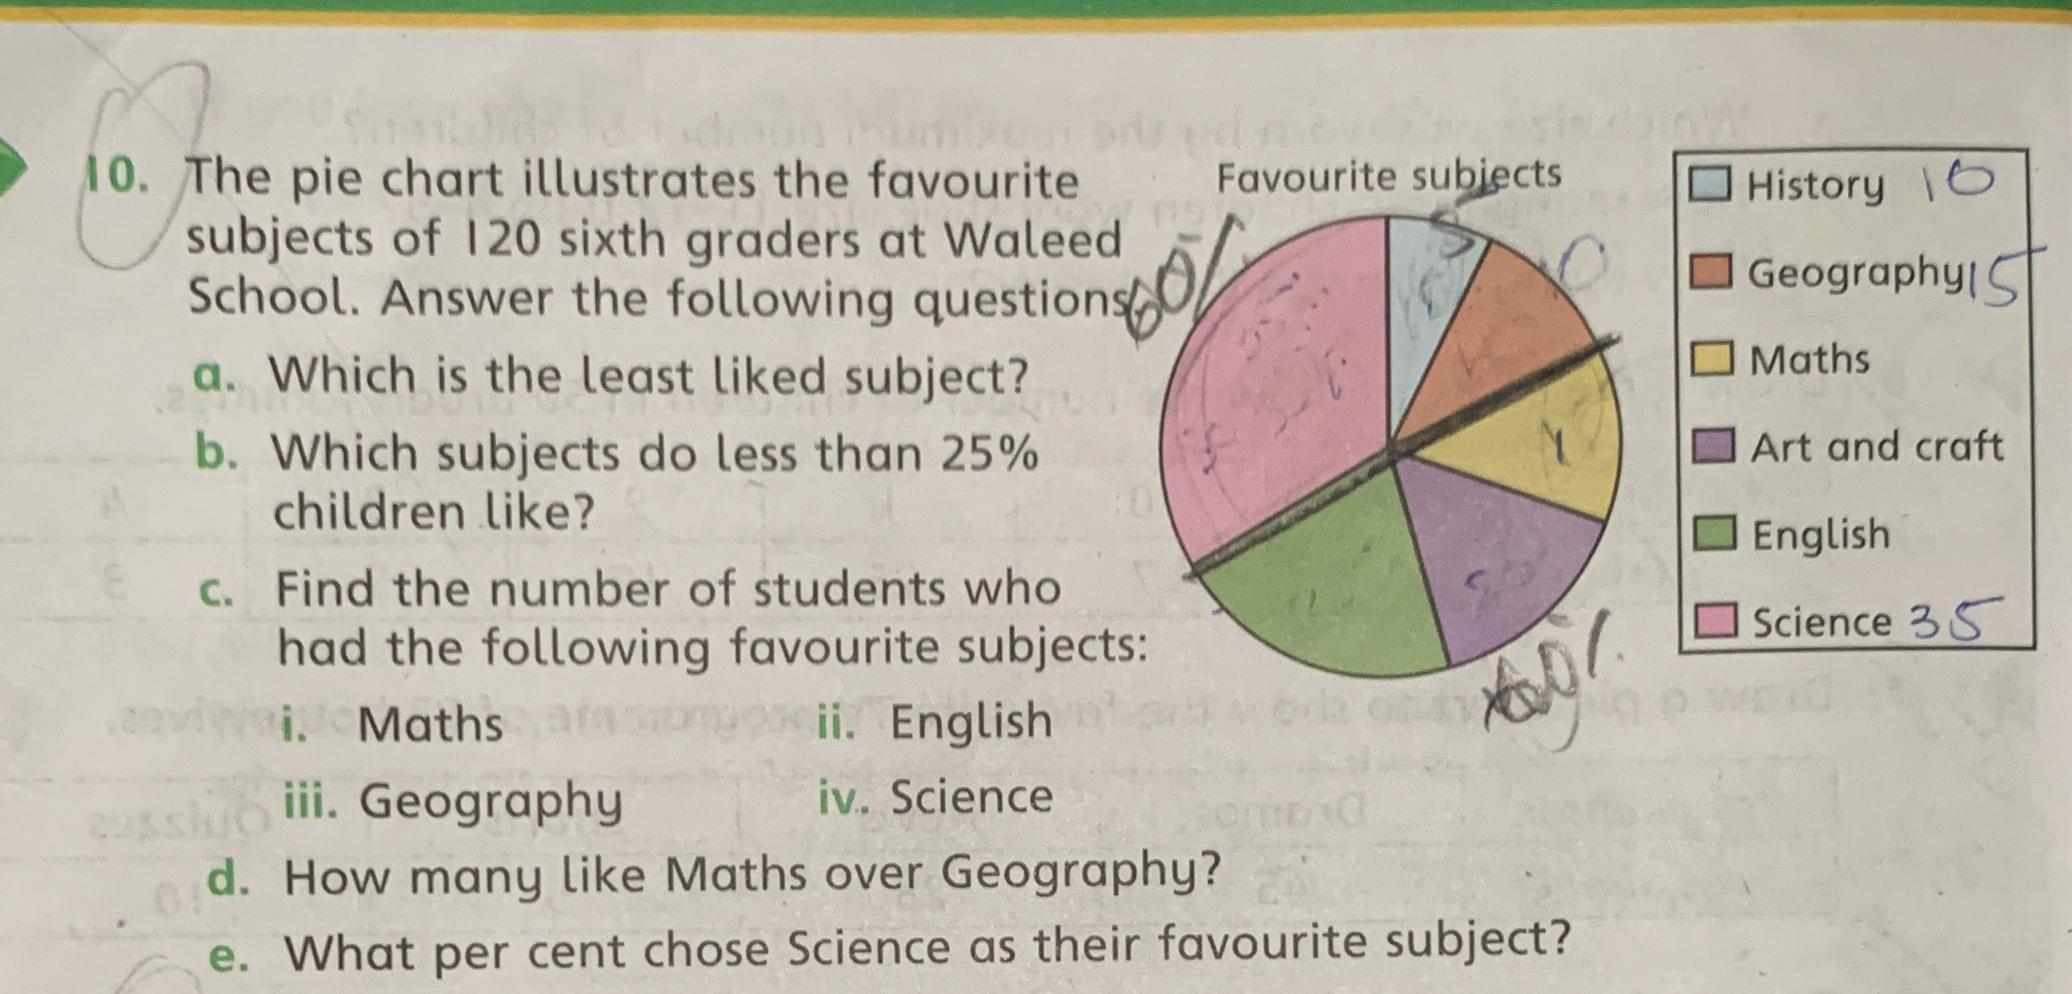
The pie chart illustrates the favourite subjects of 120 sixth graders at Waleed School. Answer the following questions: a. Which is the least liked subject? b. Which subjects do le... The pie chart illustrates the favourite subjects of 120 sixth graders at Waleed School. Answer the following questions: a. Which is the least liked subject? b. Which subjects do less than 25% children like? c. Find the number of students who had the following favourite subjects: i. Maths ii. English iii. Geography iv. Science d. How many like Maths over Geography? e. What per cent chose Science as their favourite subject?

Understand the Problem
The question involves analyzing a pie chart representing the favorite subjects of 120 sixth graders at Waleed School. The user is asked to answer multiple questions based on the data presented in the chart, including identifying the least liked subject, subjects liked by less than 25% of students, and specific comparisons between subjects.
Answer
a. Art and Craft b. History, Geography, Art and Craft c. i. 20, ii. 35, iii. 15, iv. 35 d. 5 e. 29.17%
Answer for screen readers
a. Art and Craft
b. History, Geography, Art and Craft
c. i. 20, ii. 35, iii. 15, iv. 35
d. 5
e. 29.17%
Steps to Solve
- Identify the least liked subject
From the pie chart, we can see the number of students who like each subject:
- History: 10
- Geography: 15
- Maths: 20
- Art and Craft: 5
- English: 35
- Science: 35
The least liked subject is Art and Craft with only 5 students.
- Determine subjects liked by less than 25% of students
To find the subjects liked by less than 25% of students, calculate 25% of 120:
$$ 25% \text{ of } 120 = 0.25 \times 120 = 30 $$
Subjects liked by less than 30 students:
- History: 10 (less than 30)
- Geography: 15 (less than 30)
- Art and Craft: 5 (less than 30)
So, History, Geography, and Art and Craft are subjects liked by less than 25%.
- Count students for specific subjects
- Maths: 20 students like Maths.
- English: 35 students like English.
- Geography: 15 students like Geography.
- Science: 35 students like Science.
- Compare preferences for Maths over Geography
To find how many more students like Maths than Geography: $$ 20 \text{ (Maths)} - 15 \text{ (Geography)} = 5 $$
So, 5 more students prefer Maths over Geography.
- Calculate percentage of students who chose Science
To find the percentage of students who chose Science:
$$ \text{Percentage} = \left( \frac{\text{Number of students who like Science}}{\text{Total number of students}} \right) \times 100 $$
$$ \text{Percentage} = \left( \frac{35}{120} \right) \times 100 = 29.17% $$
So, approximately 29.17% of students chose Science as their favorite subject.
a. Art and Craft
b. History, Geography, Art and Craft
c. i. 20, ii. 35, iii. 15, iv. 35
d. 5
e. 29.17%
More Information
This analysis of student preferences helps educators understand which subjects are popular and which may need more attention or improvement. Notably, Art and Craft has the least appeal among students, indicating potential areas for curriculum enhancement.
Tips
- Miscalculating the percentage: Always ensure the total number used in the percentage formula is correct; in this case, it is the total number of students (120).
- Confusing the number of students with the percentage: Remember to differentiate between the count of students and their corresponding percentages.
AI-generated content may contain errors. Please verify critical information