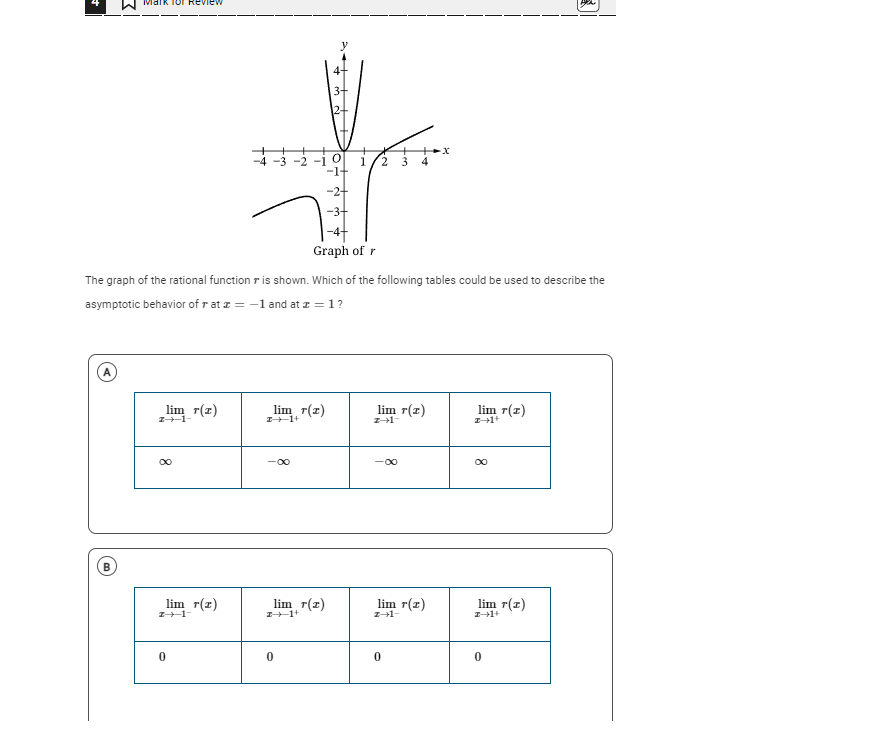
The graph of the rational function r is shown. Which of the following tables could be used to describe the asymptotic behavior of r at x = -1 and at x = 1?

Understand the Problem
The question is asking which table of limits corresponds to the asymptotic behavior of the rational function r at the specified values of x, -1 and 1, based on the provided graph. This will involve analyzing the limits to determine the behavior of the function near those points.
Answer
A: \( \lim_{x \to -1} r(x) = -\infty, \lim_{x \to 1} r(x) = 0 \)
Answer for screen readers
Table A is correct, with limits:
- ( \lim_{x \to -1} r(x) = -\infty )
- ( \lim_{x \to 1} r(x) = 0 )
Steps to Solve
- Analyze the Graph at ( x = -1 )
Look at the behavior of the graph as ( x ) approaches -1. The graph appears to have a vertical asymptote at this point, indicating that as ( x ) approaches -1 from the left, ( r(x) ) goes to ( -\infty ), and as ( x ) approaches -1 from the right, ( r(x) ) goes to ( +\infty ).
Thus, we conclude: $$ \lim_{x \to -1^-} r(x) = -\infty $$ $$ \lim_{x \to -1^+} r(x) = +\infty $$
- Analyze the Graph at ( x = 1 )
Now, observe the graph as ( x ) approaches 1. The behavior indicates that ( r(x) ) approaches a finite number from both sides (it appears to approach the value of 0).
Therefore, we conclude: $$ \lim_{x \to 1^-} r(x) = 0 $$ $$ \lim_{x \to 1^+} r(x) = 0 $$
- Summarize the Limits
In summary, the limits can be represented as follows:
-
At ( x = -1 ):
- ( \lim_{x \to -1^-} r(x) = -\infty )
- ( \lim_{x \to -1^+} r(x) = +\infty )
-
At ( x = 1 ):
- ( \lim_{x \to 1^-} r(x) = 0 )
- ( \lim_{x \to 1^+} r(x) = 0 )
- Match the Findings with the Tables
Based on the analysis above, the correct limits match with Table A:
- ( \lim_{x \to -1^-} r(x) = -\infty )
- ( \lim_{x \to -1^+} r(x) = +\infty )
- ( \lim_{x \to 1^-} r(x) = 0 )
- ( \lim_{x \to 1^+} r(x) = 0 )
Table A is correct, with limits:
- ( \lim_{x \to -1} r(x) = -\infty )
- ( \lim_{x \to 1} r(x) = 0 )
More Information
The asymptotic behavior of rational functions can often be identified using limits, particularly at points where vertical asymptotes occur. Analyzing the graph reveals where these limits will approach infinity or some finite value.
Tips
- Confusing vertical asymptotes with horizontal ones. Remember, vertical asymptotes indicate that the function tends to ( \pm \infty ).
- Misreading the graph's behavior near critical points.