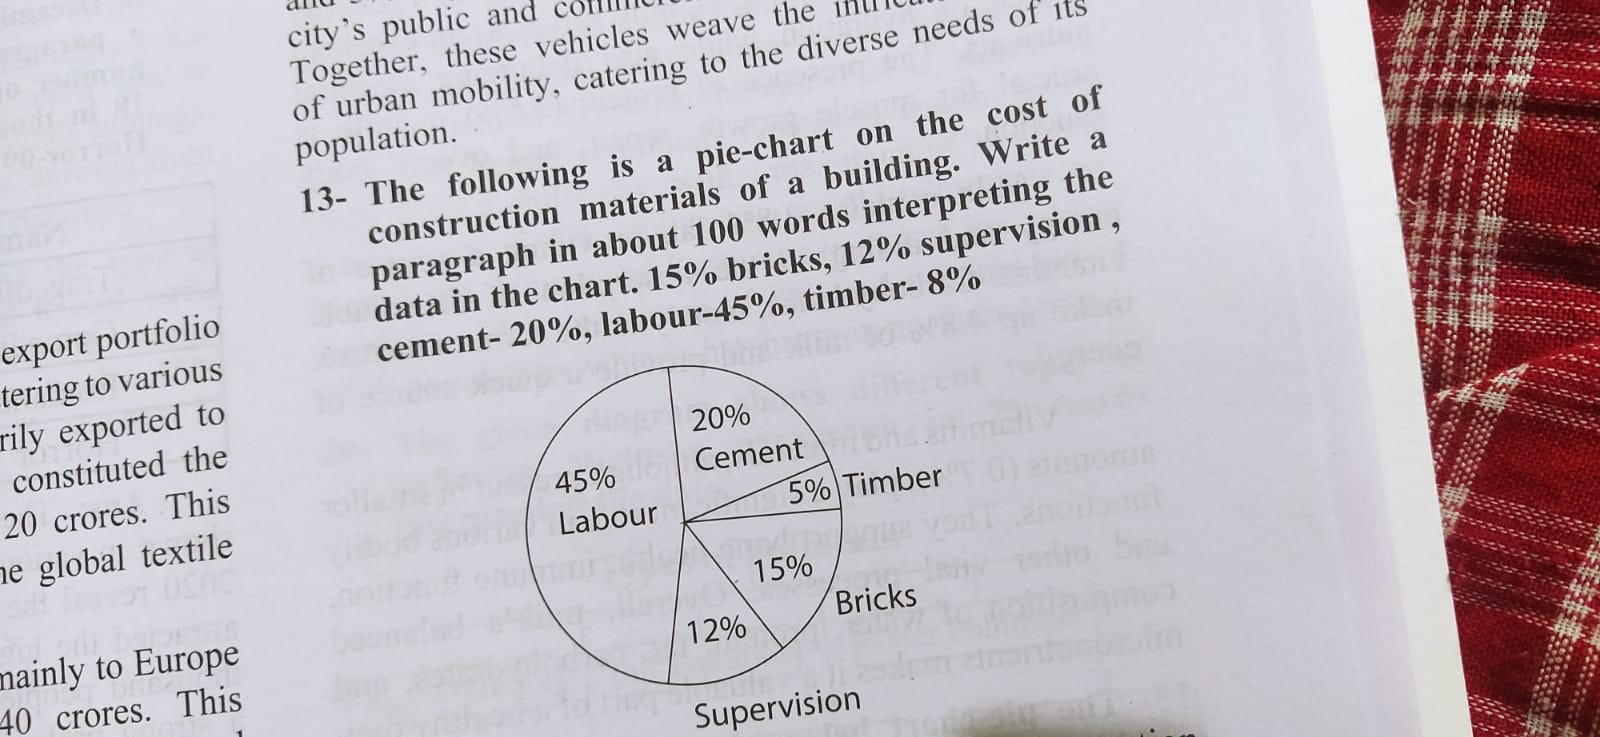
The following is a pie chart on the cost of construction materials of a building. Write a paragraph in about 100 words interpreting the data in the chart. 15% bricks, 12% supervisi... The following is a pie chart on the cost of construction materials of a building. Write a paragraph in about 100 words interpreting the data in the chart. 15% bricks, 12% supervision, cement- 20%, labour- 45%, timber- 8%

Understand the Problem
The question is asking to write a 100-word paragraph interpreting the data presented in a pie chart related to construction materials costs. It mentions the percentages for bricks, cement, labour, supervision, and timber.
Answer
Labour is 45% of costs. Cement is 20%. Bricks are 15%. Supervision is 12%. Timber is 8%.
The pie chart illustrates the distribution of costs among various components in a building project. Labour emerges as the most significant expense, accounting for 45% of the total costs. Cement follows next, constituting 20%, which reflects its essential role in construction. Bricks make up 15% of the expenses, serving as a key building block. Supervision costs are 12%, highlighting the importance of project oversight. Timber comprises the smallest portion at 8%, indicating its lesser role compared to other materials. This allocation highlights the varying importance and cost contributions of each component in construction.
Answer for screen readers
The pie chart illustrates the distribution of costs among various components in a building project. Labour emerges as the most significant expense, accounting for 45% of the total costs. Cement follows next, constituting 20%, which reflects its essential role in construction. Bricks make up 15% of the expenses, serving as a key building block. Supervision costs are 12%, highlighting the importance of project oversight. Timber comprises the smallest portion at 8%, indicating its lesser role compared to other materials. This allocation highlights the varying importance and cost contributions of each component in construction.
More Information
Labour costs typically dominate construction expenses due to intensive manpower needs.
Tips
When interpreting pie charts, ensure percentages add up to 100% and compare relative sizes.
Sources
AI-generated content may contain errors. Please verify critical information