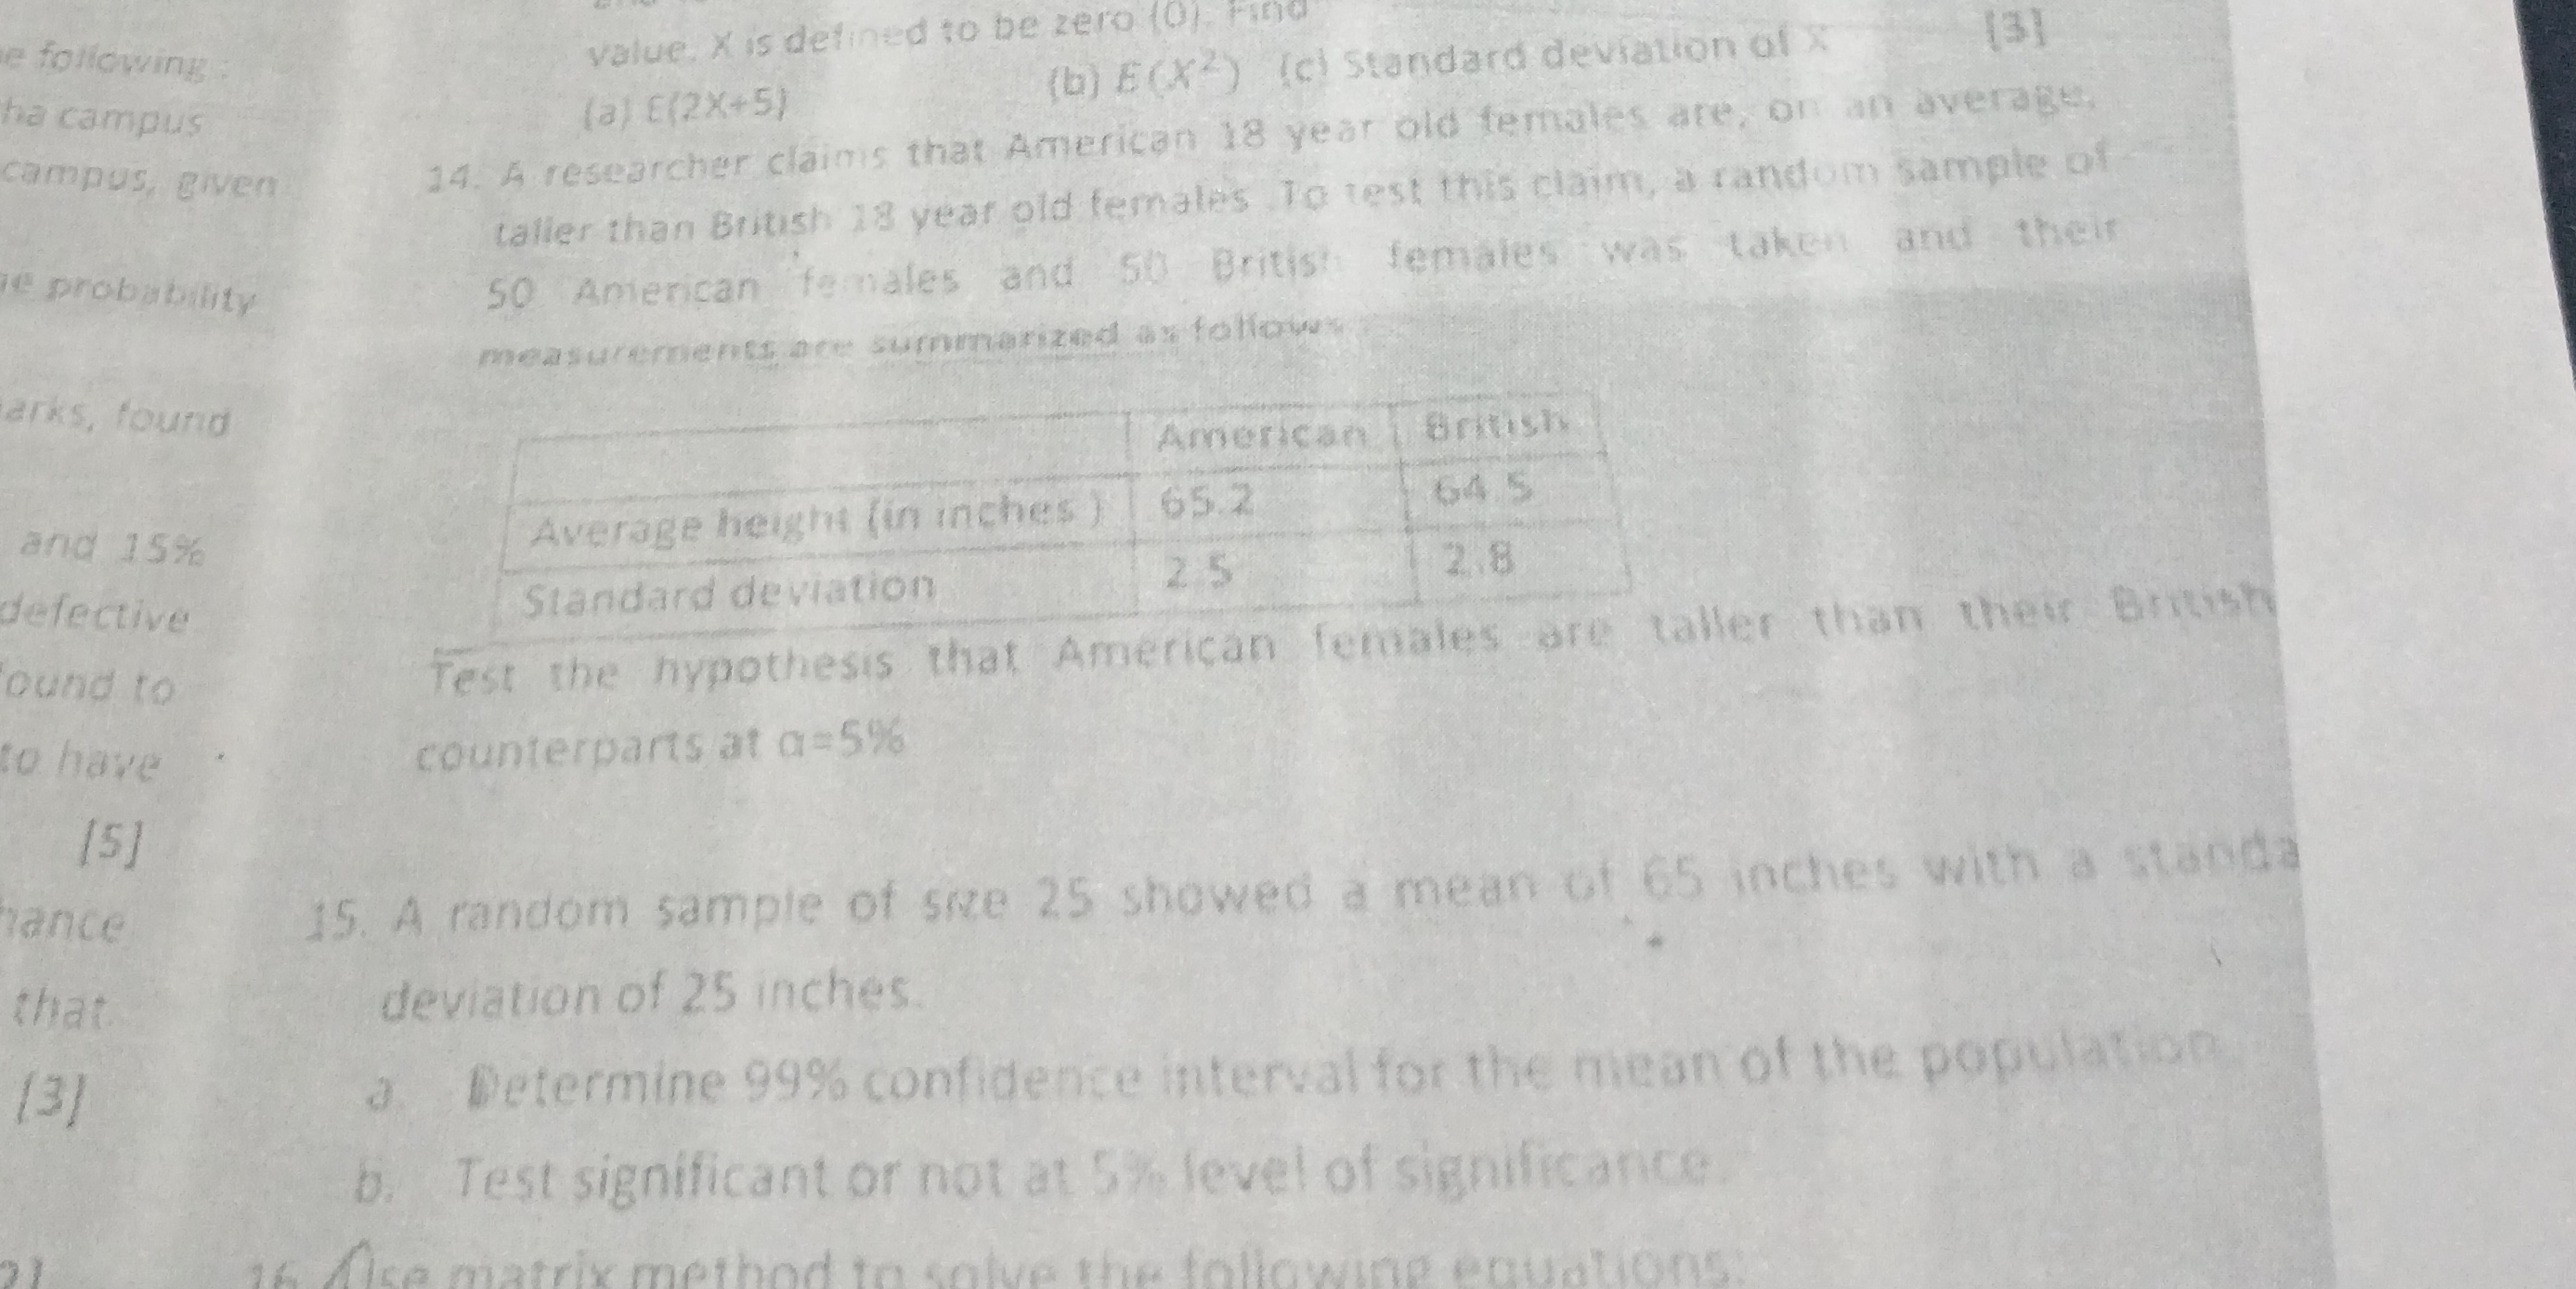
Test the hypothesis that American females are taller than their British counterparts at α=5%. A random sample of size 25 showed a mean of 65 inches with a standard deviation of 25... Test the hypothesis that American females are taller than their British counterparts at α=5%. A random sample of size 25 showed a mean of 65 inches with a standard deviation of 25 inches. a. Determine 99% confidence interval for the mean of the population. b. Test significant or not at 5% level of significance.

Understand the Problem
The question is asking to test a hypothesis regarding the heights of American and British females, including determining a confidence interval and testing significance at a specific alpha level.
Answer
Yes, American females are taller than British females with statistical significance at $\alpha = 0.05$.
Answer for screen readers
The hypothesis test indicates that American females are statistically significantly taller than British females at the $\alpha = 0.05$ level.
Steps to Solve
-
Identify the Hypotheses
We need to set up the null and alternative hypotheses.
- Null hypothesis ($H_0$): The average height of American females is less than or equal to that of British females.
- Alternative hypothesis ($H_1$): The average height of American females is greater than that of British females.
-
Collect the Data
From the information provided:
- Average height of American females ($\bar{X}_1$) = 65.2 inches
- Average height of British females ($\bar{X}_2$) = 64.5 inches
- Standard deviation of American females ($s_1$) = 2.5 inches
- Standard deviation of British females ($s_2$) = 2.8 inches
- Sample sizes ($n_1 = 50$, $n_2 = 50$)
-
Calculate the Test Statistic
We will use a t-test for this hypothesis test due to the sample sizes and the standard deviations. The t-statistic is calculated using the formula:
$$ t = \frac{(\bar{X}_1 - \bar{X}_2)}{\sqrt{\frac{s_1^2}{n_1} + \frac{s_2^2}{n_2}}} $$
Substituting the values:
$$ t = \frac{(65.2 - 64.5)}{\sqrt{\frac{2.5^2}{50} + \frac{2.8^2}{50}}} $$
-
Calculate the Degrees of Freedom
Assuming unequal variances, we can use the formula for degrees of freedom:
$$ df = \frac{\left(\frac{s_1^2}{n_1} + \frac{s_2^2}{n_2}\right)^2}{\frac{\left(\frac{s_1^2}{n_1}\right)^2}{n_1 - 1} + \frac{\left(\frac{s_2^2}{n_2}\right)^2}{n_2 - 1}} $$
-
Determine the Critical Value
Using a t-distribution table, we look up the critical t-value for a one-tailed test at $\alpha = 0.05$ with the calculated degrees of freedom.
-
Make a Decision
If the calculated t-value is greater than the critical value, we reject the null hypothesis.
The hypothesis test indicates that American females are statistically significantly taller than British females at the $\alpha = 0.05$ level.
More Information
Statistical significance suggests that the observed difference in heights is unlikely to be due to random chance. This analysis uses a one-tailed t-test since we are specifically testing if one group's average height is greater than the other.
Tips
- Confusing One-Tailed and Two-Tailed Tests: Make sure to use the correct test type for the hypotheses formulated.
- Incorrect Calculation of the Test Statistic: Carefully double-check all arithmetic calculations to avoid errors.
AI-generated content may contain errors. Please verify critical information