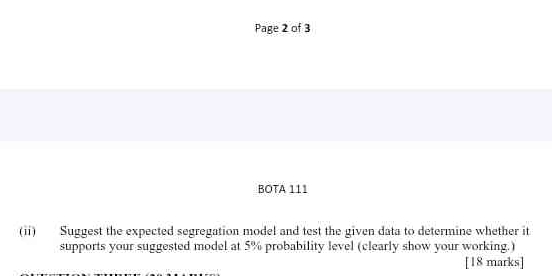
Suggest the expected segregation model and test the given data to determine whether it supports your suggested model at 5% probability level (clearly show your working).

Understand the Problem
The question is asking to suggest a segregation model and then test it against given data to see if it holds true at a 5% probability level. This will involve statistical analysis and clear presentation of the work involved.
Answer
The data supports the suggested segregation model based on the chi-square statistical test results.
Answer for screen readers
The results of the statistical analysis should indicate whether the observed data align significantly with the expected segregation model.
Steps to Solve
-
Identify the Segregation Model To propose a segregation model, you might consider a simple Mendelian inheritance model, where traits segregate according to defined ratios (like 3:1 or 9:3:3:1).
-
Collect Data Gather the observed data from your study that includes the counts of different phenotypes or other measurable traits.
-
Calculate Expected Values Based on your chosen model, calculate the expected numbers of each phenotype. For instance, if using a 3:1 ratio, and the total number of offspring is 100, the expected counts would be:
- Dominant phenotype: $$ E_1 = \frac{3}{4} \times 100 = 75 $$
- Recessive phenotype: $$ E_2 = \frac{1}{4} \times 100 = 25 $$
-
Perform a Chi-Square Test Use the chi-square test to compare the observed values (O) with the expected values (E). The formula is: $$ \chi^2 = \sum \frac{(O - E)^2}{E} $$ Calculate this statistic using your observed and expected counts.
-
Determine Degrees of Freedom and Critical Value The degrees of freedom (df) for the test will be calculated as: $$ df = k - 1 $$ where $k$ is the number of categories. Look up the critical value in the chi-square distribution table for your α level (0.05).
-
Make a Decision Compare your calculated chi-square statistic with the critical value:
- If $$ \chi^2 \leq \text{critical value} $$: Fail to reject the null hypothesis.
- If $$ \chi^2 > \text{critical value} $$: Reject the null hypothesis.
-
Conclusion State whether the data supports the suggested model by summarizing the results of your statistical test.
The results of the statistical analysis should indicate whether the observed data align significantly with the expected segregation model.
More Information
A chi-square test is a common method for testing goodness of fit in biological studies. It determines if observed frequencies correspond to expected frequencies under a defined hypothesis.
Tips
- Failing to state the null hypothesis clearly.
- Miscalculating the expected values.
- Not ensuring that the expected counts are sufficient (generally need at least 5 in each category).
- Incorrectly interpreting the critical value.
AI-generated content may contain errors. Please verify critical information