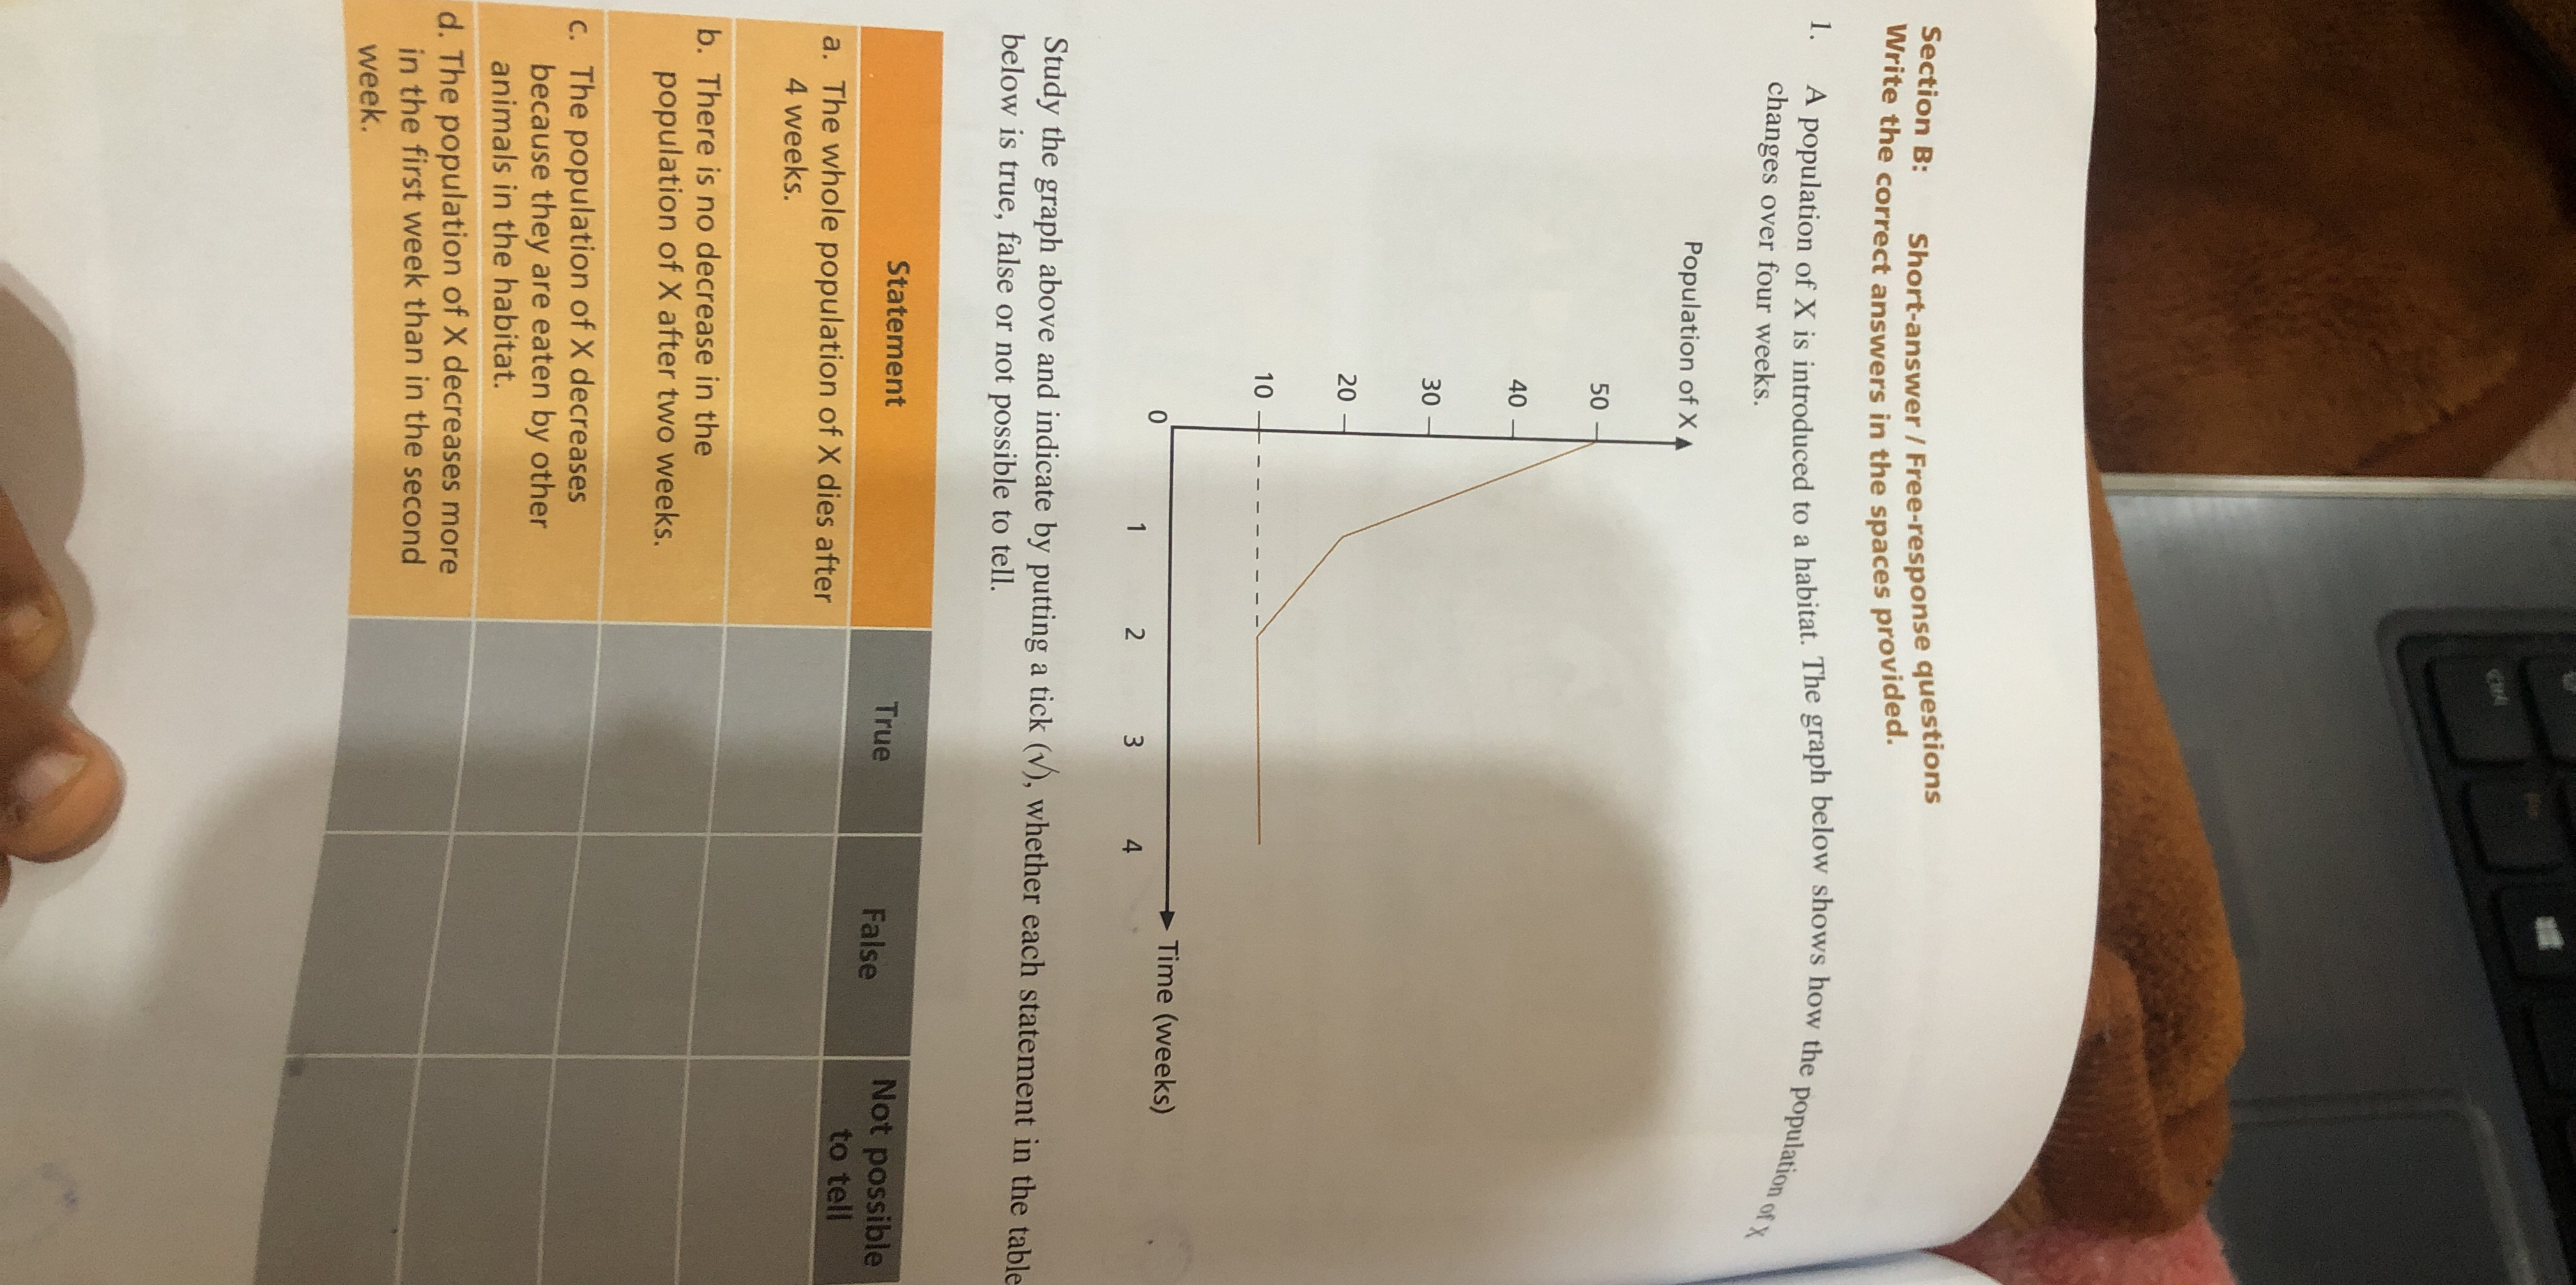
Study the graph above and indicate by putting a tick (✓) whether each statement below is true, false, or not possible to tell.

Understand the Problem
The question is asking whether the statements provided about the population of a species (X) based on a graph are true, false, or not possible to determine. To answer it, you would analyze the graph that shows changes in the population over four weeks.
Answer
a) True; b) False; c) Not possible to tell; d) True
a) True; b) False; c) Not possible to tell; d) True
Answer for screen readers
a) True; b) False; c) Not possible to tell; d) True
More Information
The graph shows that the population of X remains constant after the initial increase, leading to conclusions based on the graph's slope.
Tips
Ensure to understand the relationship between time and population trends as shown in the graph.
AI-generated content may contain errors. Please verify critical information