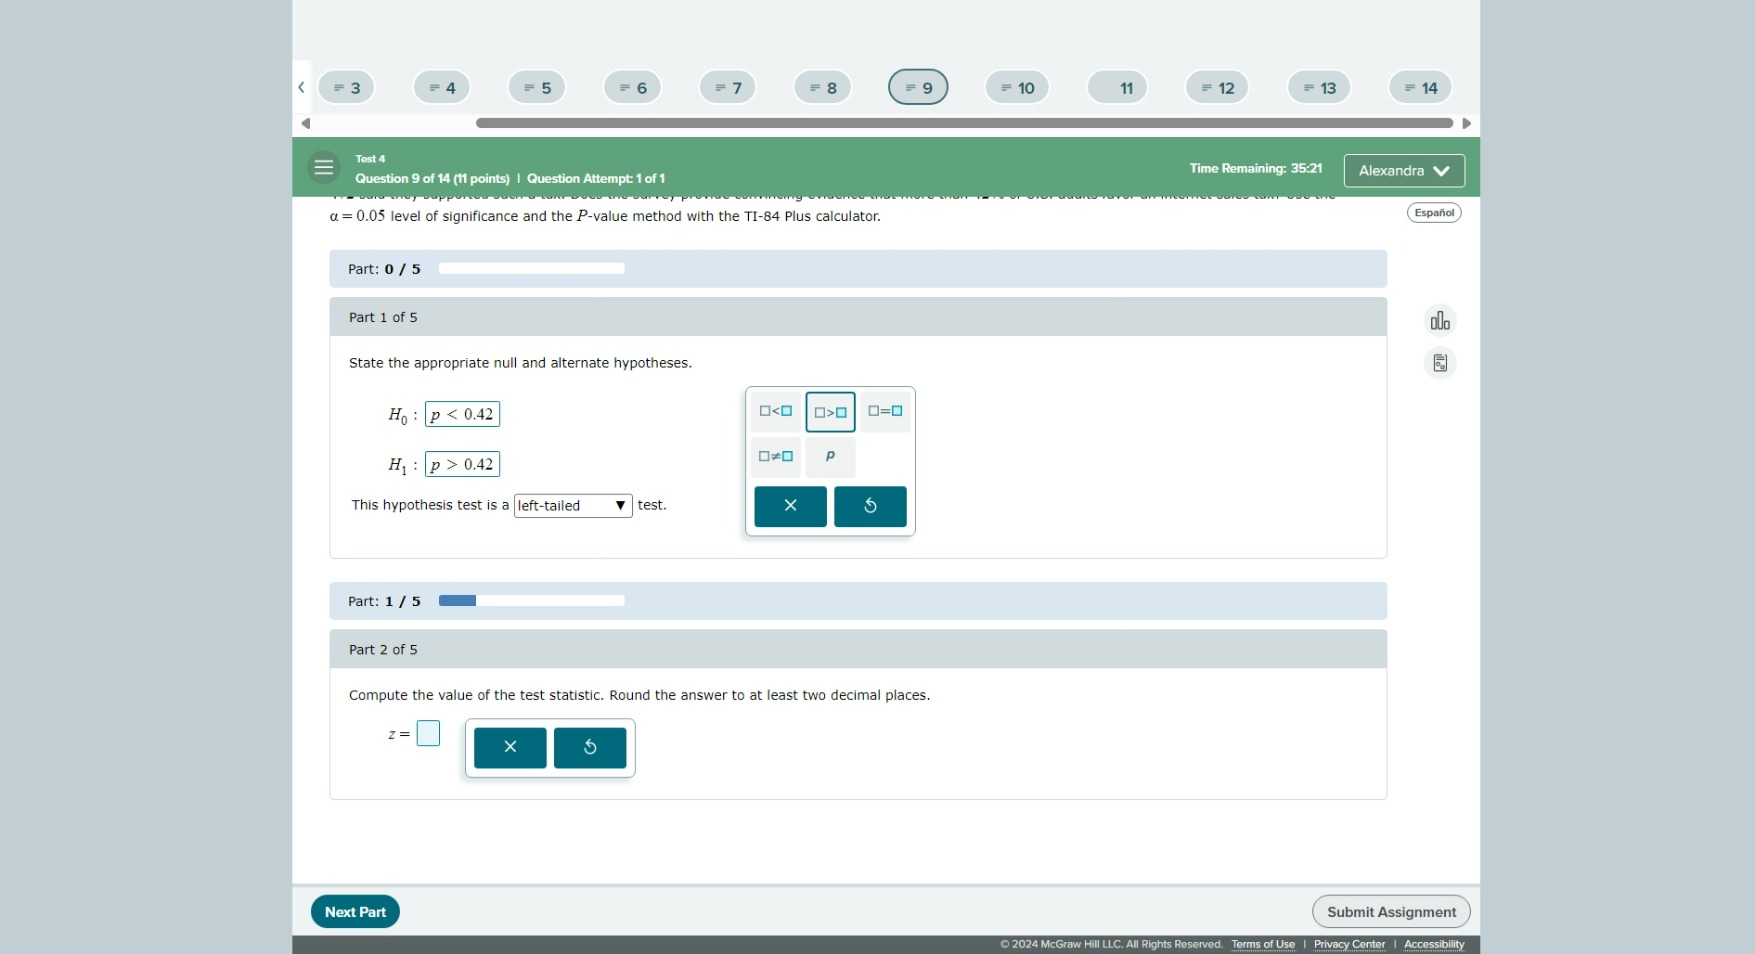
State the appropriate null and alternate hypotheses. Compute the value of the test statistic. Round the answer to at least two decimal places.

Understand the Problem
The question appears to involve hypothesis testing, specifically requiring the user to state the null and alternative hypotheses and compute a test statistic using given information. This involves understanding statistical concepts related to hypothesis testing.
Answer
The null hypothesis is $H_0: p \leq 0.42$ and the alternative hypothesis is $H_1: p > 0.42$. The test statistic can be calculated using the formula provided, depending on specific values.
Answer for screen readers
The null hypothesis is $H_0: p \leq 0.42$ and the alternative hypothesis is $H_1: p > 0.42$.
The test statistic $z$ value will depend on specific values of $\hat{p}$ and $n$, which we need to compute based on the data provided in the context.
Steps to Solve
-
State the Null and Alternative Hypotheses
The null hypothesis ($H_0$) states that the population proportion is less than or equal to 0.42, while the alternative hypothesis ($H_1$) states that it is greater than 0.42:
- $H_0: p \leq 0.42$
- $H_1: p > 0.42$
-
Identify the Type of Test
Since the alternative hypothesis indicates that we are looking for evidence that the proportion is greater than 0.42, this is a right-tailed test.
-
Compute the Test Statistic
The formula for the test statistic (z) when testing a proportion is: $$ z = \frac{\hat{p} - p_0}{\sqrt{\frac{p_0(1 - p_0)}{n}}} $$ Where:
- $\hat{p}$ = sample proportion
- $p_0$ = hypothesized population proportion (0.42)
- $n$ = sample size
Substitute the values of $\hat{p}$, $p_0$, and $n$ into the equation.
-
Calculate with Given Values
Insert the provided values into the formula to compute the z-value, ensuring only to round to at least two decimal places after computation.
-
Report the Test Statistic Rounded
State the calculated test statistic value rounded to two decimal places.
The null hypothesis is $H_0: p \leq 0.42$ and the alternative hypothesis is $H_1: p > 0.42$.
The test statistic $z$ value will depend on specific values of $\hat{p}$ and $n$, which we need to compute based on the data provided in the context.
More Information
In hypothesis testing, the null hypothesis is generally assumed true until evidence indicates otherwise. The test statistic helps determine whether to reject the null hypothesis.
Tips
- Misinterpreting the hypotheses: Make sure to correctly identify the null and alternative hypotheses.
- Incorrectly calculating the standard error or using the wrong sample size: Verify the values used in the formula match those provided in the problem statement.
AI-generated content may contain errors. Please verify critical information