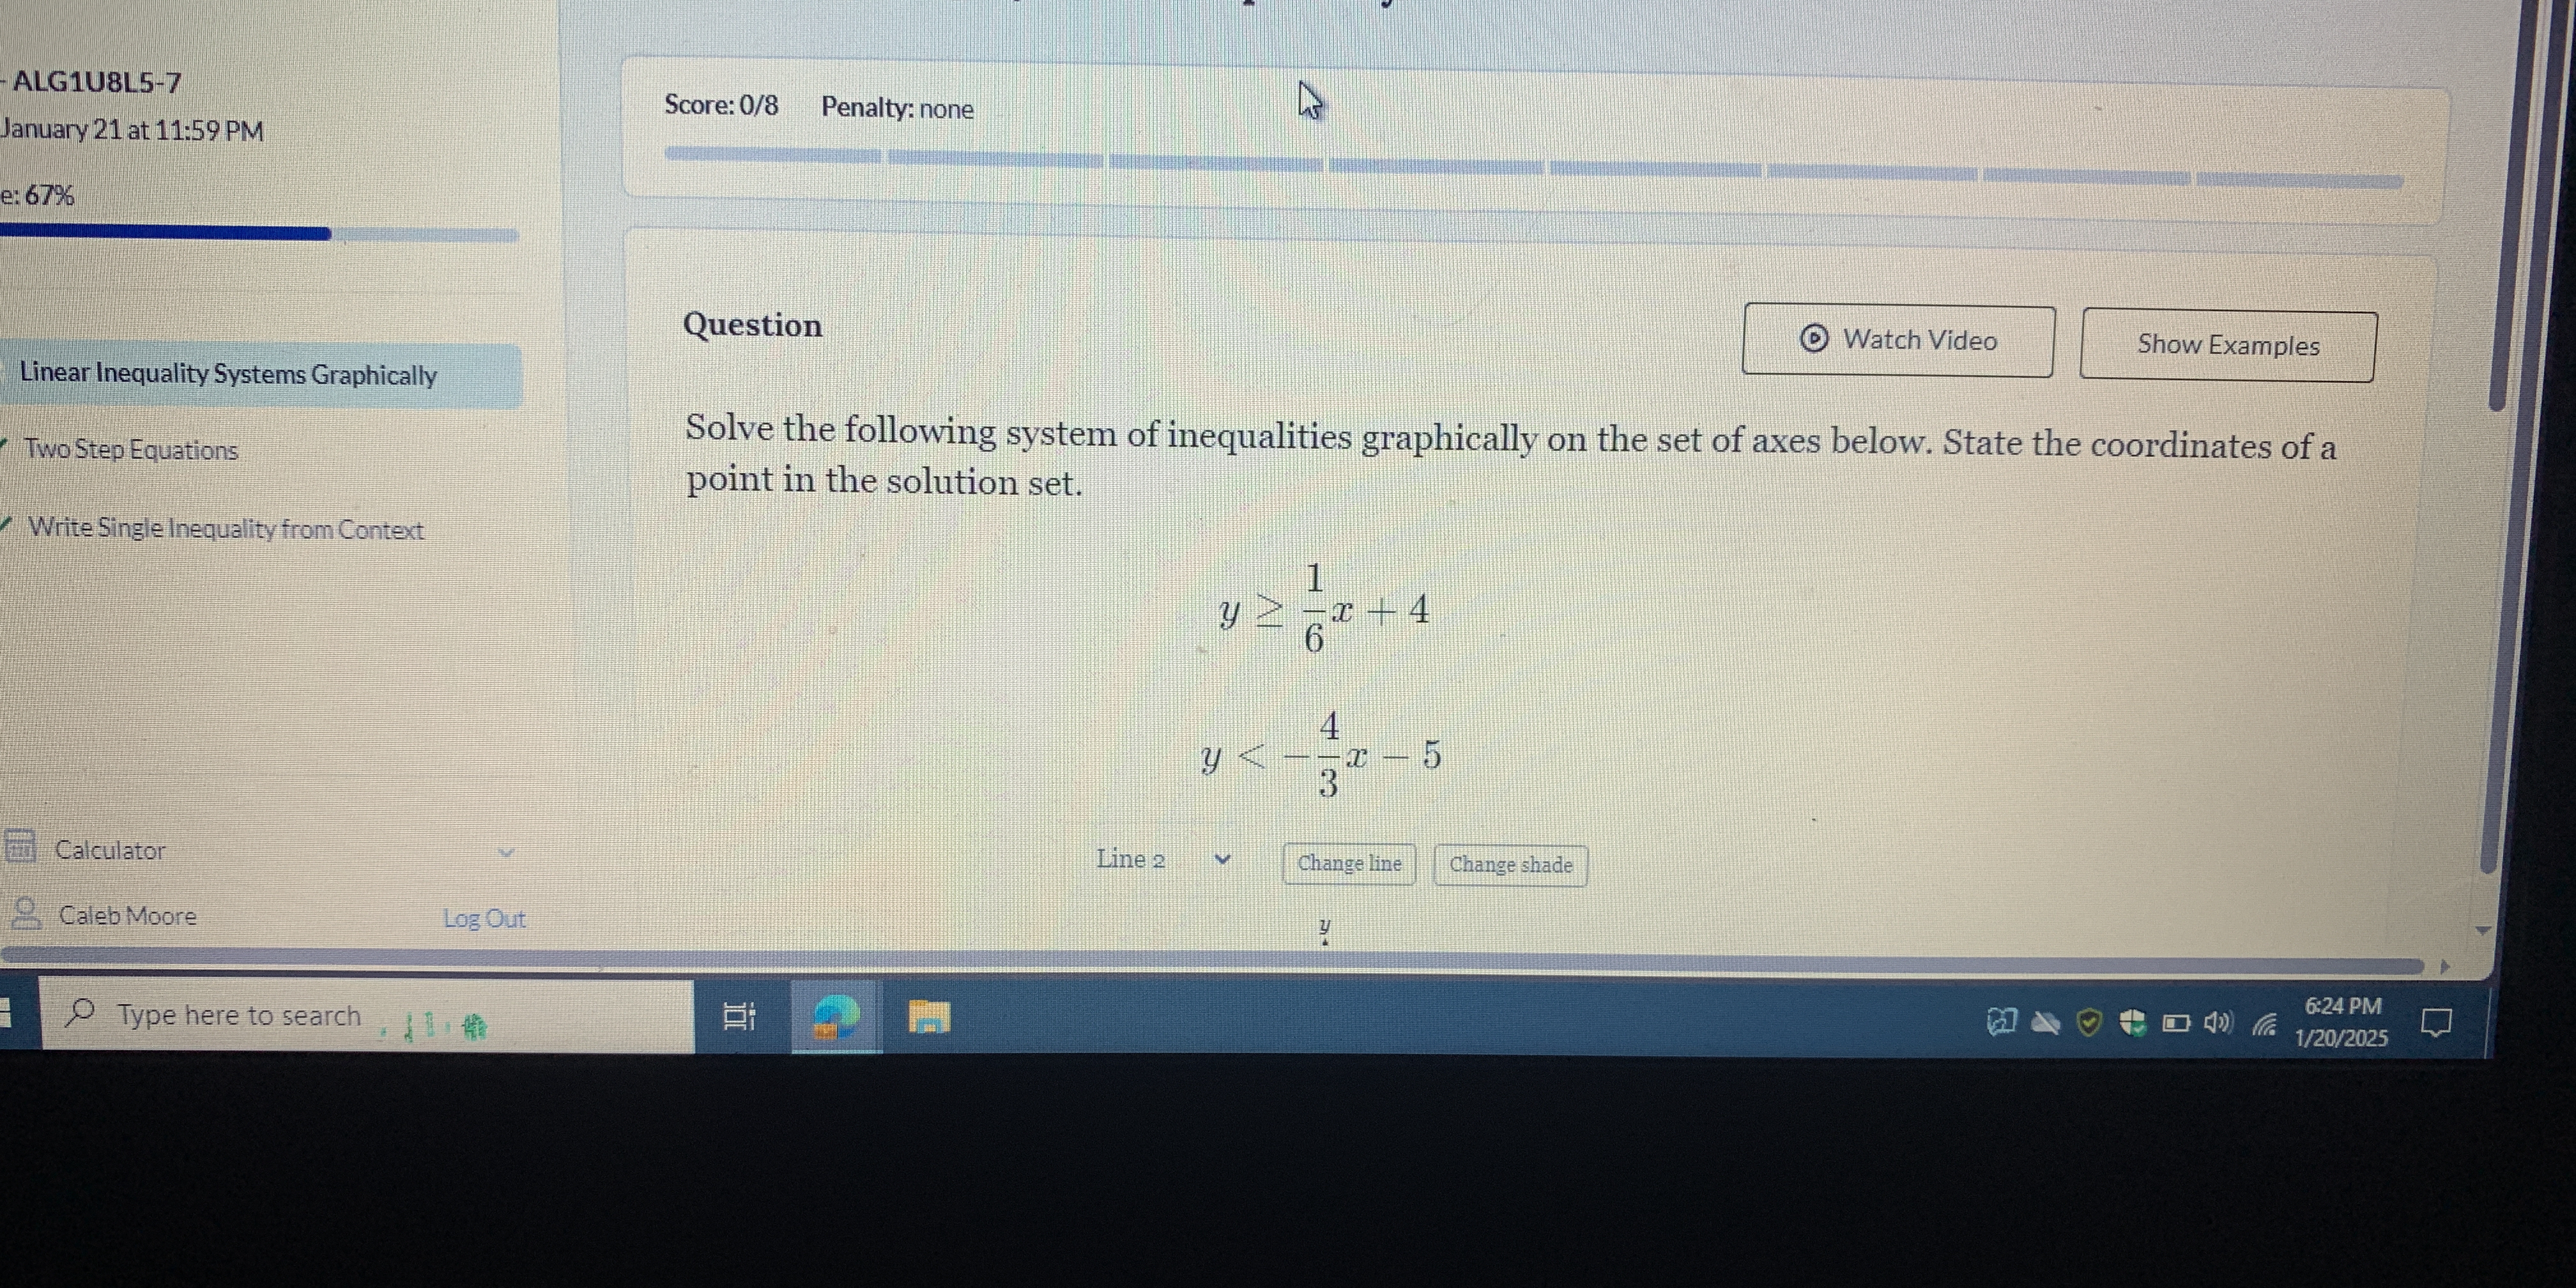
Solve the following system of inequalities graphically on the set of axes below. State the coordinates of a point in the solution set.

Understand the Problem
The question is asking to solve a system of inequalities graphically and identify a point within the solution set. It requires knowledge of how to graph linear inequalities and interpret the shaded regions.
Answer
A point in the solution set is \( (0, -6) \).
Answer for screen readers
A point in the solution set is ( (0, -6) ).
Steps to Solve
- Rearranging the inequalities
First, note the two inequalities that we need to graph:
-
( y > \frac{1}{6}x + 4 )
-
( y < -\frac{4}{3}x - 5 )
-
Graphing the first inequality
To graph the first inequality, start by converting it to the equation of a line:
$$ y = \frac{1}{6}x + 4 $$
Plot this line using points, like when ( x = 0 ), ( y = 4 ) (point (0, 4)) and ( x = 6 ), ( y = 5 ) (point (6, 5)). Draw a dashed line because the inequality is strict (greater than).
- Shading the region for the first inequality
Since the inequality is ( y > \frac{1}{6}x + 4 ), shade above the dashed line to represent all points where ( y ) is greater than the line.
- Graphing the second inequality
Next, graph the second inequality by converting it to the equation of a line:
$$ y = -\frac{4}{3}x - 5 $$
Plot this line using points, such as when ( x = 0 ), ( y = -5 ) (point (0, -5)) and ( x = 3 ), ( y = -9 ) (point (3, -9)). Again, use a dashed line since it's a strict inequality (less than).
- Shading the region for the second inequality
For the second inequality, ( y < -\frac{4}{3}x - 5 ), shade below the dashed line to indicate all points where ( y ) is less than the line.
- Identifying the solution region
The solution to the system of inequalities is where the shaded regions of both inequalities intersect. This is the feasible region.
- Choosing a point within the solution set
Select a point that lies in the intersection of the shaded regions. A suitable point could be ( (0, -6) ).
A point in the solution set is ( (0, -6) ).
More Information
The process of graphing inequalities involves identifying linear equations and shading the valid regions based on the inequality signs. The interaction of these shaded areas defines the solution set.
Tips
- Forgetting to use dashed lines for strict inequalities can lead to incorrect representations.
- Incorrect shading above/below the line can result in wrong solution regions.
- Not checking if the point chosen actually lies within the shaded area.
AI-generated content may contain errors. Please verify critical information