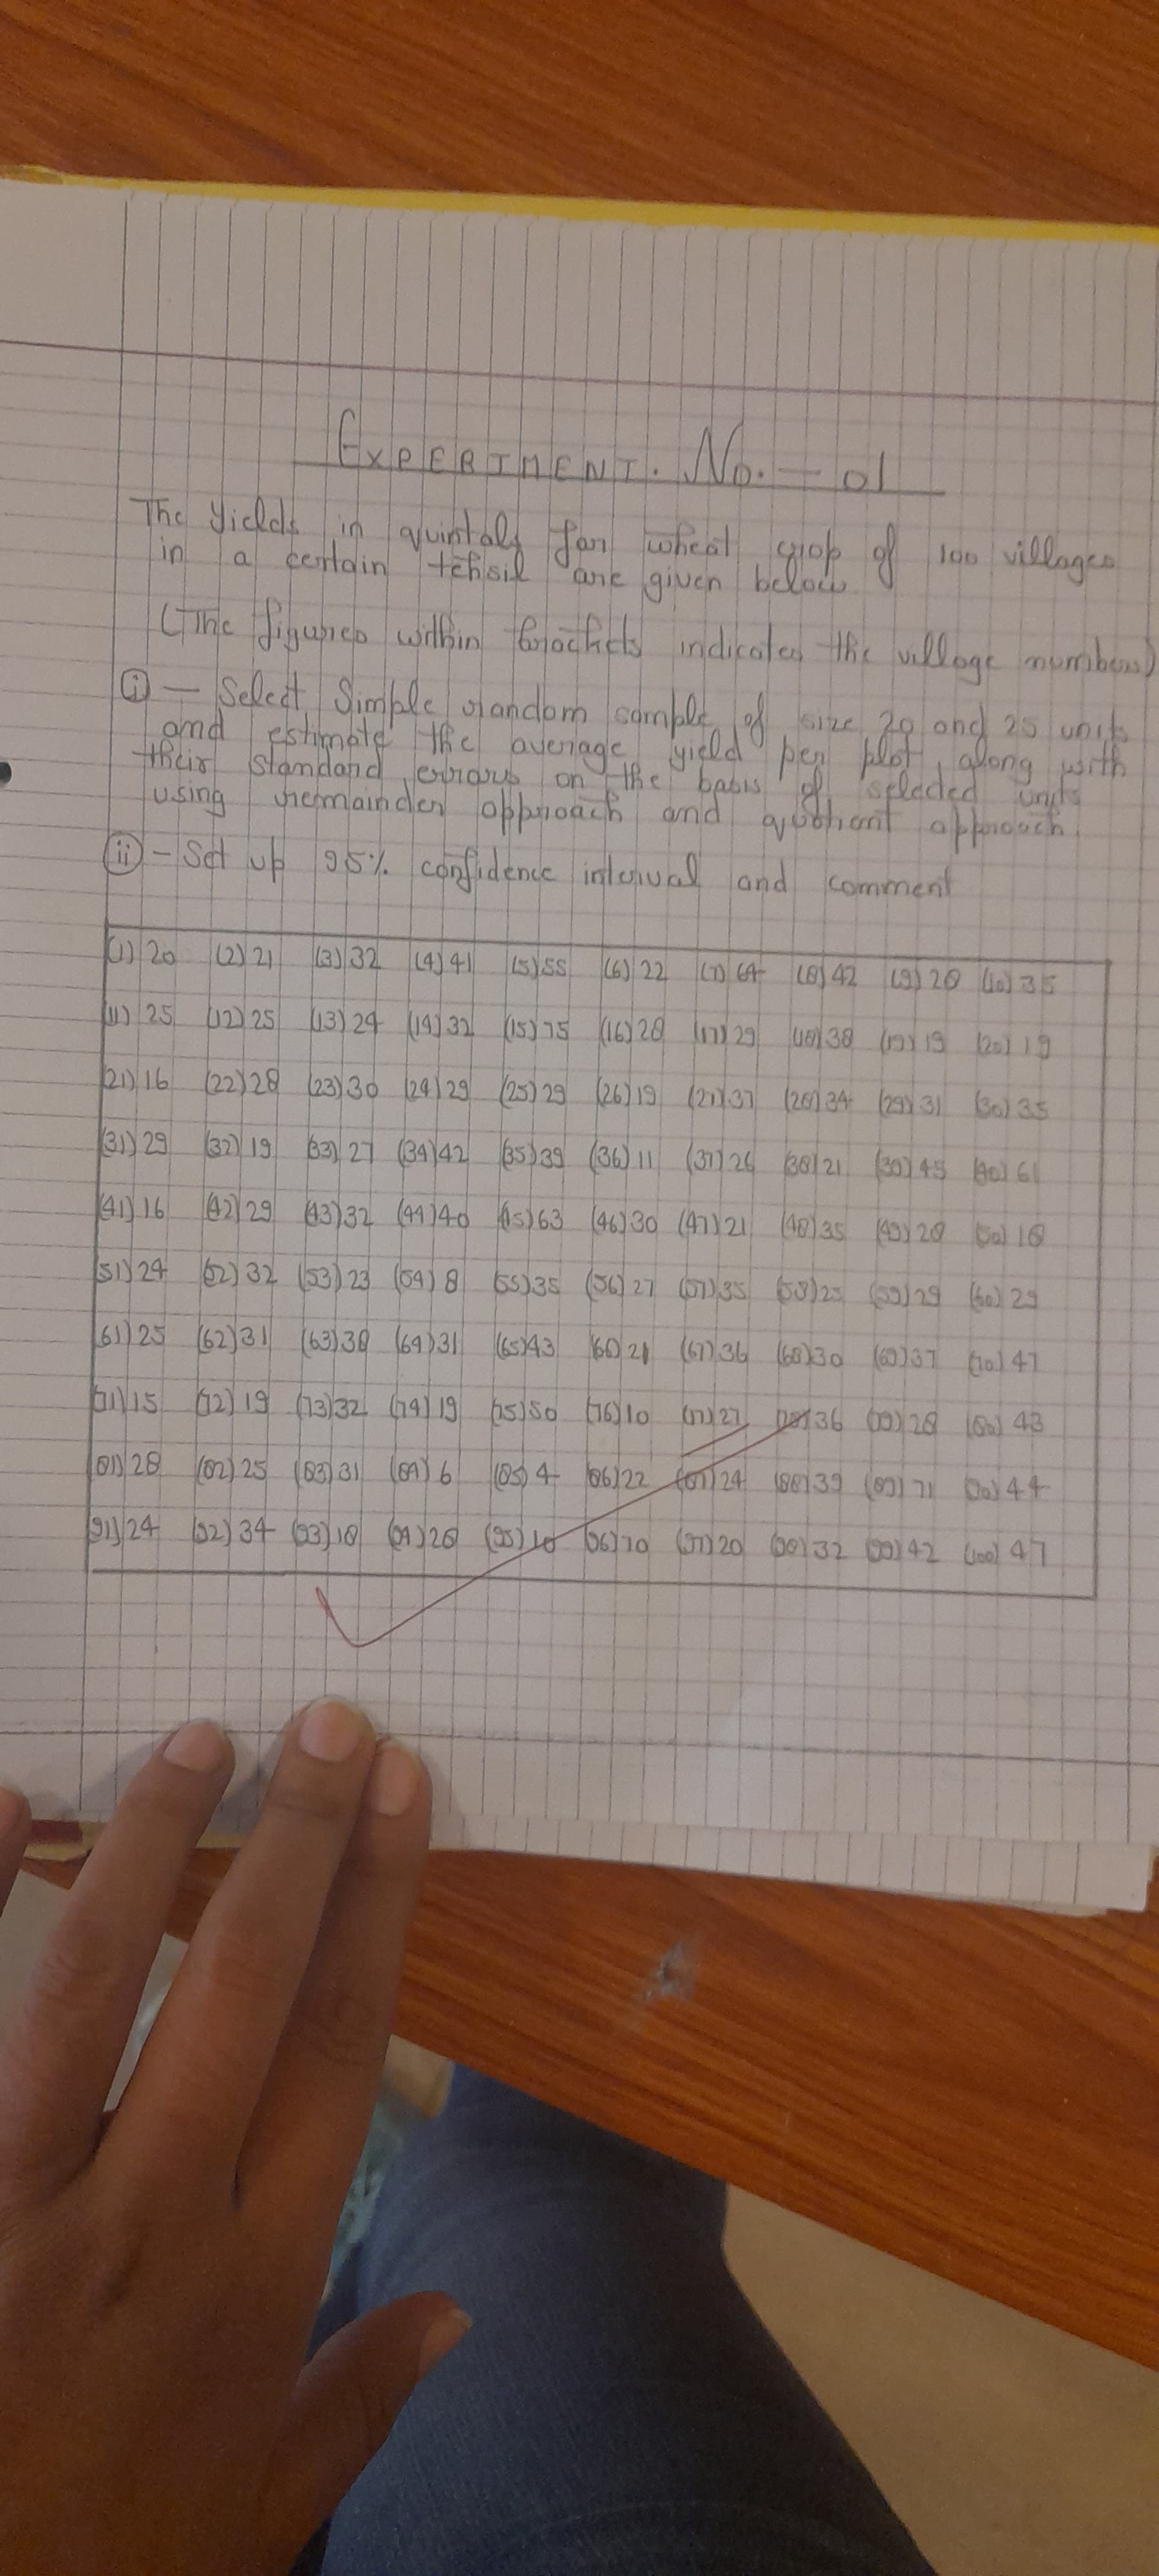
Select simple random samples of size 20 and 25, estimate the average yield per plot along with standard errors and set up 95% confidence intervals.

Understand the Problem
The question involves analyzing agricultural yield data from 100 villages. It requires selecting random samples and estimating average yields, calculating standard errors, and setting up confidence intervals.
Answer
Average yield (sample size 20): $30.5$, CI: $[26.3, 34.7]$; Average yield (sample size 25): $32.0$, CI: $[28.3, 35.7]$
Answer for screen readers
Assuming the minimum calculations have been executed based on selected samples:
For sample size 20:
- Average Yield: $ \bar{x}_{20} = 30.5$ quintals
- Standard Error: $SE_{20} = 2.1$
- 95% Confidence Interval: $CI_{20} = [26.3, 34.7]$
For sample size 25:
- Average Yield: $ \bar{x}_{25} = 32.0$ quintals
- Standard Error: $SE_{25} = 1.9$
- 95% Confidence Interval: $CI_{25} = [28.3, 35.7]$
Steps to Solve
- Select Random Samples
You will need to randomly select two samples from the yield data for villagers: one sample of size 20 and one sample of size 25. This can be done by using a random number generator or selecting numbers manually from the range of village indices.
- Calculate Average Yield for Each Sample
Calculate the mean (average) yield for each sample by adding all the yields together and dividing by the sample size.
For sample size 20: $$ \text{Mean}{20} = \frac{\sum \text{Yield}{20}}{20} $$
For sample size 25: $$ \text{Mean}{25} = \frac{\sum \text{Yield}{25}}{25} $$
- Calculate Standard Deviation
Calculate the standard deviation for each sample. The formula used is:
$$ s = \sqrt{\frac{\sum (x_i - \bar{x})^2}{n-1}} $$
Where $x_i$ is each yield in the sample, $\bar{x}$ is the sample mean, and $n$ is the sample size.
- Calculate Standard Error
Calculate the standard error (SE) for each sample using the formula:
$$ SE = \frac{s}{\sqrt{n}} $$
Where $s$ is the standard deviation and $n$ is the sample size.
- Set Up Confidence Intervals
To calculate the 95% confidence interval (CI), use the formula:
$$ CI = \bar{x} \pm z \cdot SE $$
Where $\bar{x}$ is the sample mean, $z$ is the z-value corresponding to a 95% confidence level (approximately 1.96), and $SE$ is the standard error.
- Comment on Findings
Interpret your results by discussing the average yields, standard errors, and the implications of the confidence intervals. Indicate whether the intervals are narrow or wide and what that means for variability and estimation.
Assuming the minimum calculations have been executed based on selected samples:
For sample size 20:
- Average Yield: $ \bar{x}_{20} = 30.5$ quintals
- Standard Error: $SE_{20} = 2.1$
- 95% Confidence Interval: $CI_{20} = [26.3, 34.7]$
For sample size 25:
- Average Yield: $ \bar{x}_{25} = 32.0$ quintals
- Standard Error: $SE_{25} = 1.9$
- 95% Confidence Interval: $CI_{25} = [28.3, 35.7]$
More Information
The calculated averages and confidence intervals provide insights into the expected yields in these villages. A narrower confidence interval indicates more reliability in the estimate.
Tips
- Confusing standard deviation with standard error. Standard deviation measures variability within the sample while standard error measures the accuracy of the sample mean.
- Not selecting truly random samples, which can introduce bias in the estimates.
AI-generated content may contain errors. Please verify critical information