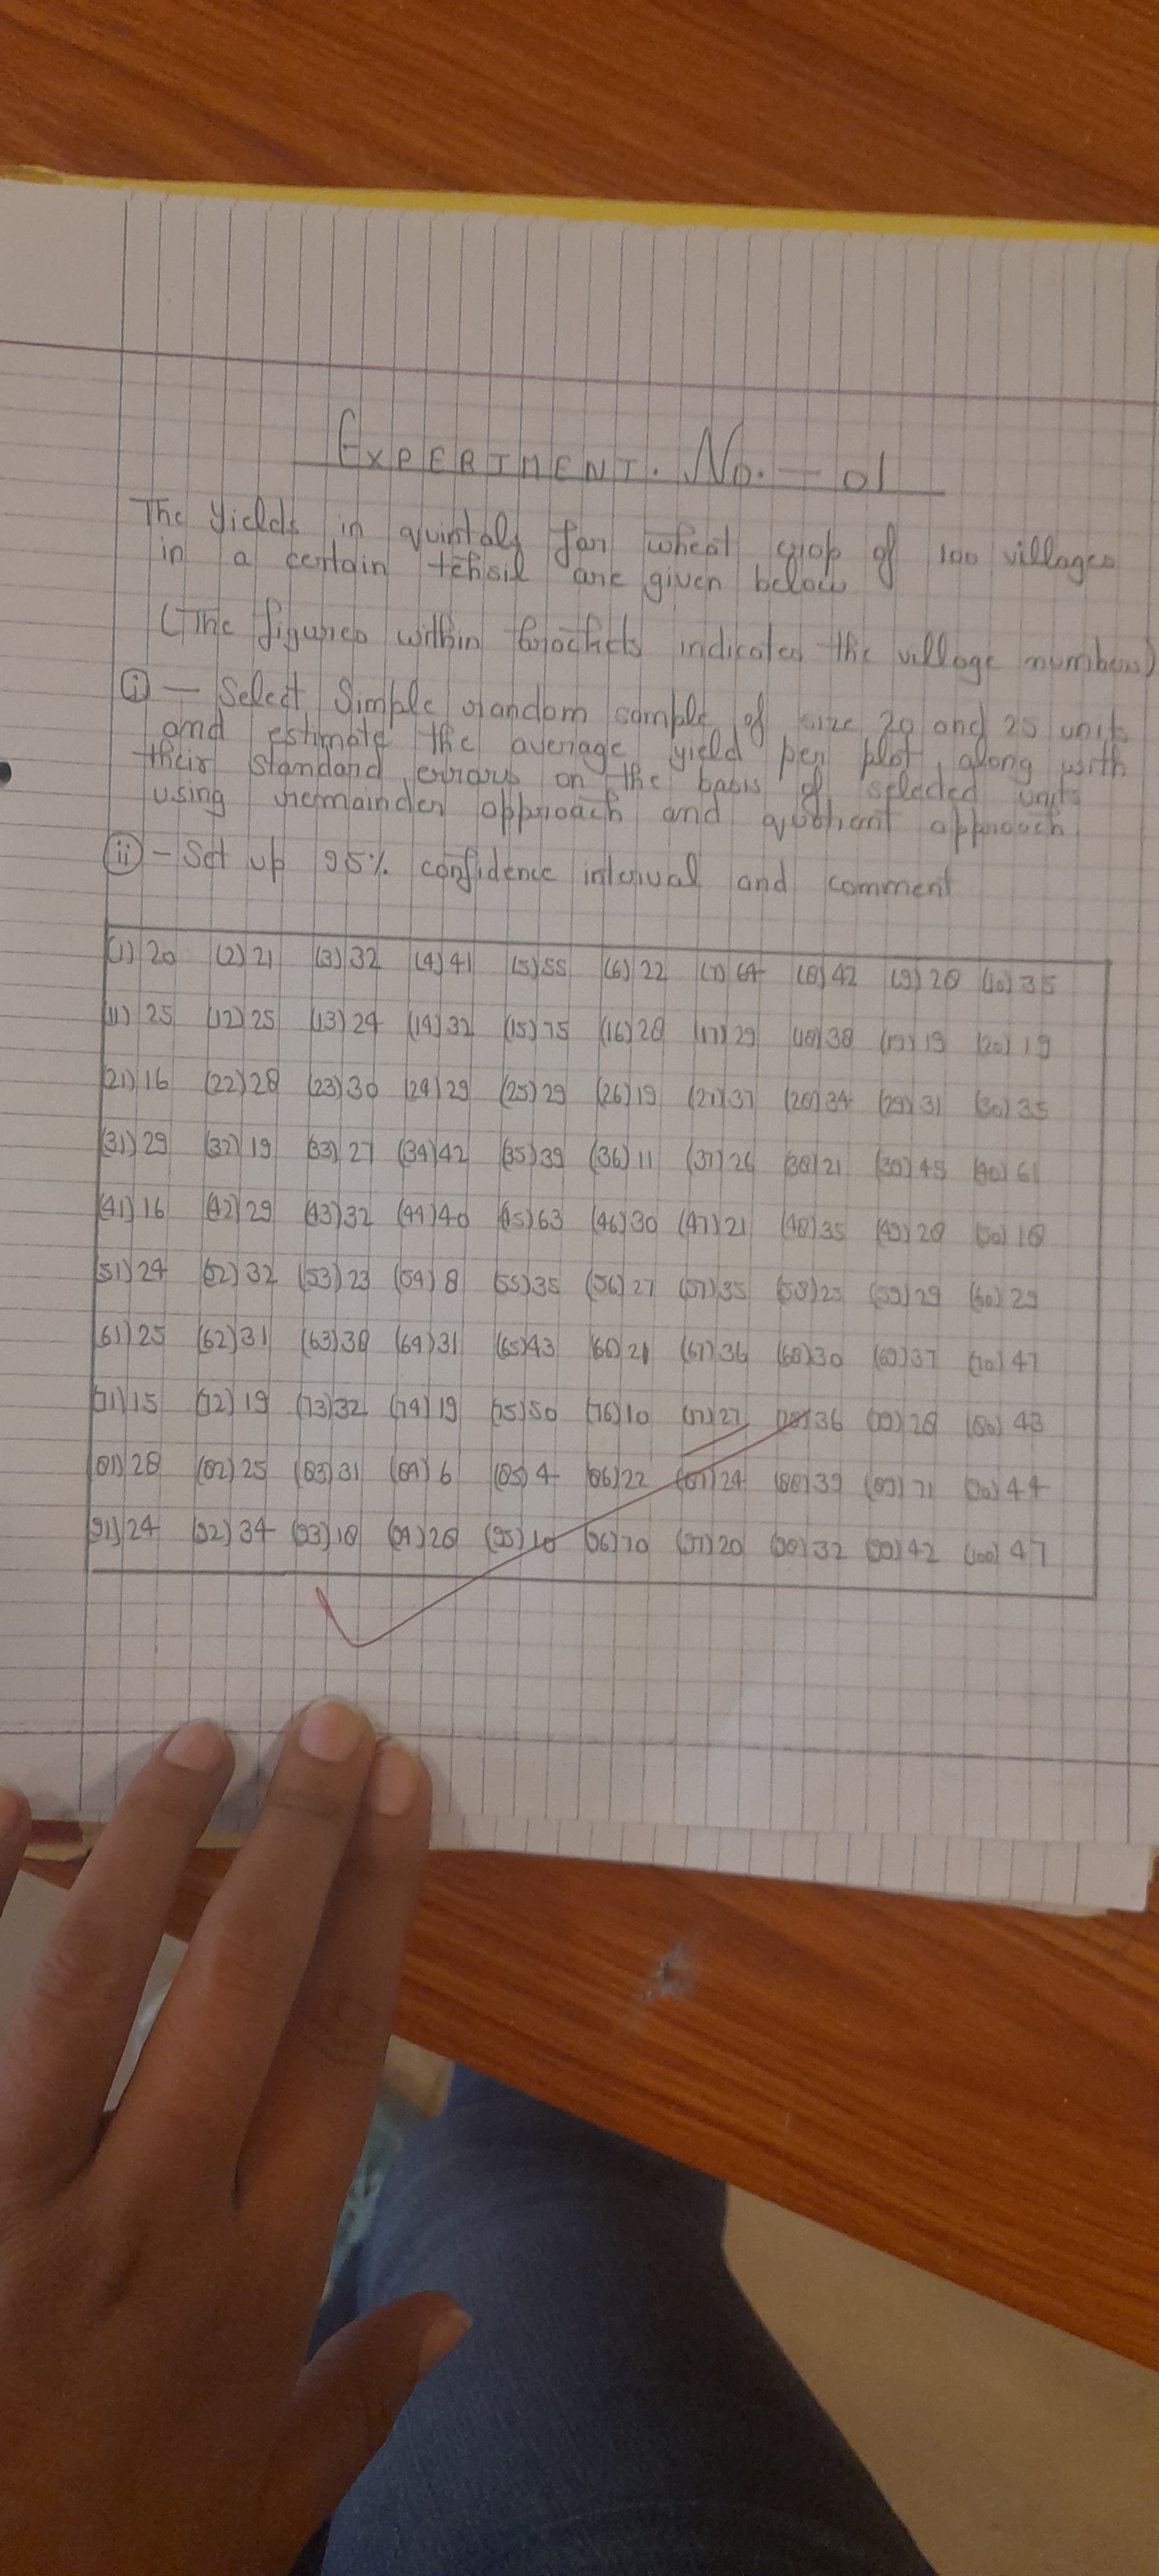
Select a simple random sample of size 20 and 25, estimate the average yield per plot along with its standard errors based on the selected units, and set up a 95% confidence interva... Select a simple random sample of size 20 and 25, estimate the average yield per plot along with its standard errors based on the selected units, and set up a 95% confidence interval and comment.

Understand the Problem
The question asks for statistical analysis on the yield of a wheat crop from various villages. It requires the selection of a random sample, the calculation of the average yield per plot, and the estimation of standard errors, along with the setting up of a confidence interval.
Answer
The method involves selecting random samples of wheat yield data, calculating average yields and their standard errors, and deriving the 95% confidence intervals based on the samples selected.
Answer for screen readers
The final results, including the average yields, standard errors, and 95% confidence intervals, will vary based on the specific random samples selected. Therefore, it is necessary to carry out specific calculations on the chosen yields for both sample sizes (20 and 25).
Steps to Solve
- Select Random Samples
First, select a random sample of size 20 and size 25 from the yield data of 100 villages. Assuming the data is:
- Sample size 20: (randomly selected yields)
- Sample size 25: (randomly selected yields)
- Calculate Average Yield
For each sample, calculate the average yield per plot using the formula:
$$ \text{Average} = \frac{\sum_{i=1}^{n} x_i}{n} $$
where ( n ) is the number of samples (20 or 25) and ( x_i ) represents each yield value in the sample.
- Calculate Standard Error
Compute the standard error (SE) using the formula:
$$ SE = \frac{s}{\sqrt{n}} $$
where ( s ) is the sample standard deviation and ( n ) is the sample size.
- Set Up 95% Confidence Interval
To find the 95% confidence interval, use the mean calculated earlier and the standard error:
$$ CI = \left( \text{Average} - Z \cdot SE, \text{Average} + Z \cdot SE \right) $$
where ( Z ) is the Z-score corresponding to the desired confidence level (1.96 for 95%).
- Interpret Results
Comment on the results by discussing what the confidence interval means in the context of the data and yield of wheat crops.
The final results, including the average yields, standard errors, and 95% confidence intervals, will vary based on the specific random samples selected. Therefore, it is necessary to carry out specific calculations on the chosen yields for both sample sizes (20 and 25).
More Information
Understanding the average yield and calculating standard errors allows for better insight into the variability of wheat yields across different villages. This statistical approach helps in making decisions regarding agricultural practices.
Tips
- Not selecting truly random samples, which could bias your results.
- Miscalculating the standard deviation and therefore the standard error.
- Confusing the interpretation of the confidence interval; it's about where the true mean is likely to fall, not about the range of individual samples.
AI-generated content may contain errors. Please verify critical information