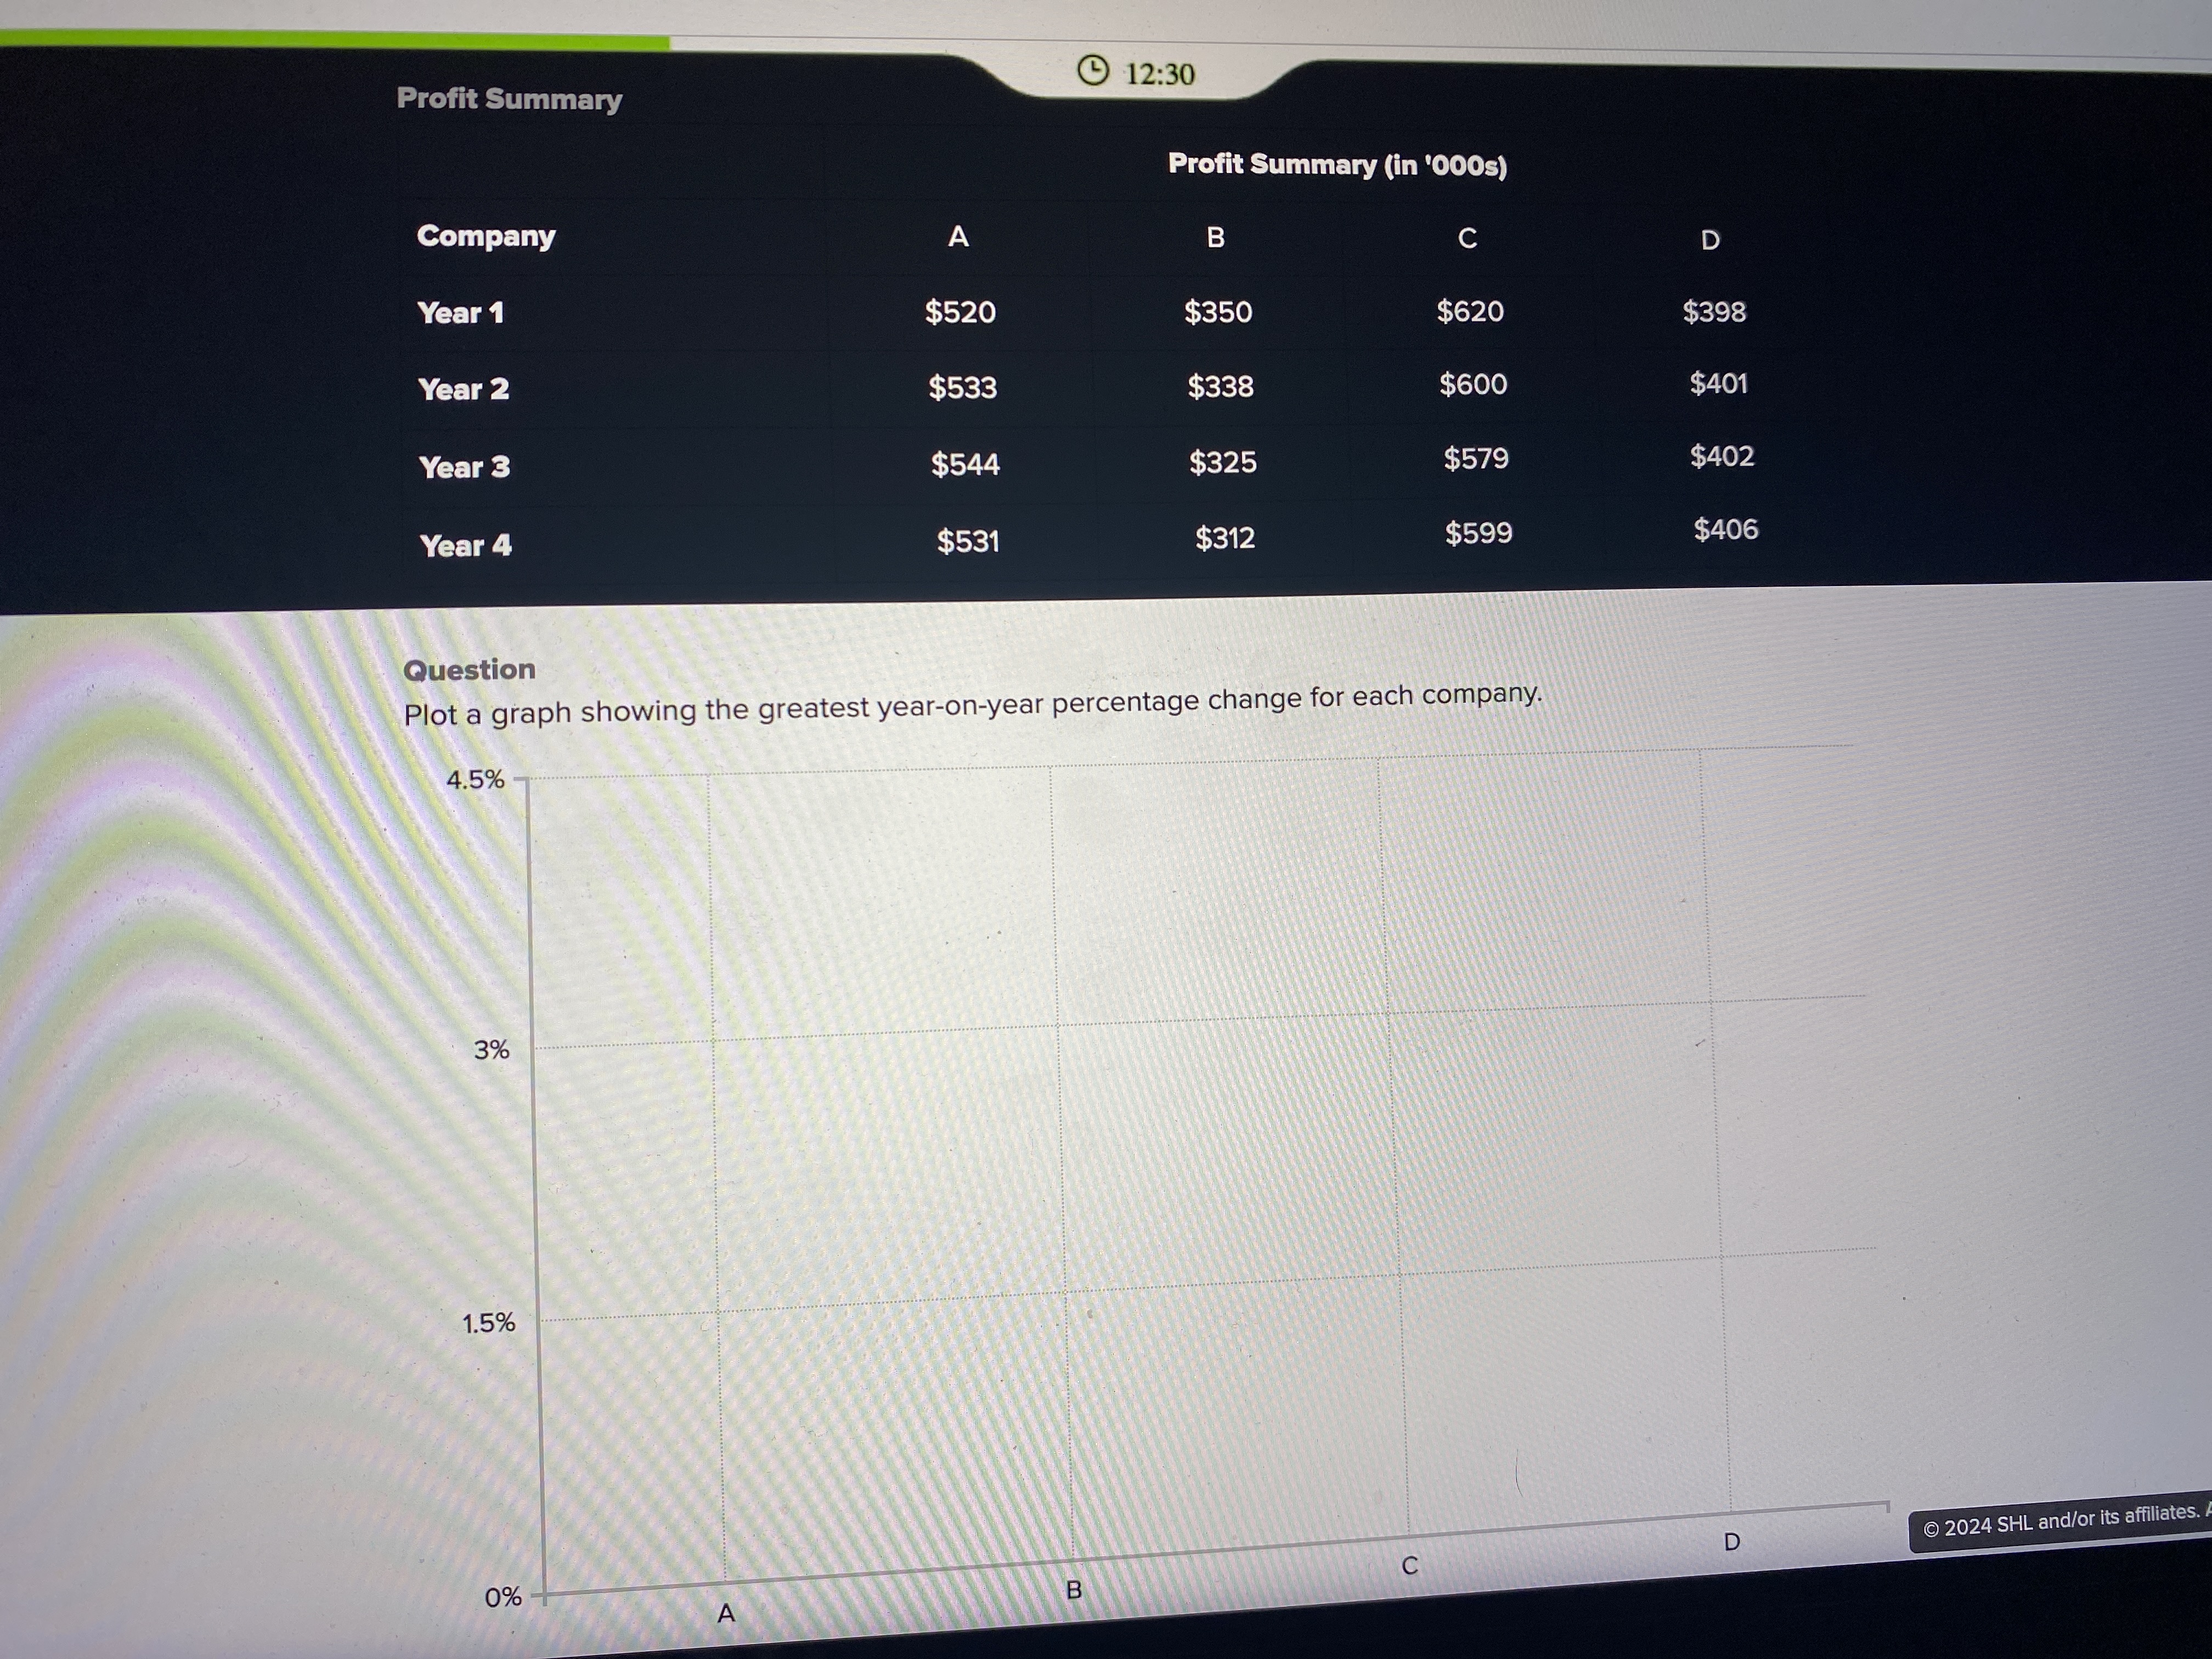
Plot a graph showing the greatest year-on-year percentage change for each company.

Understand the Problem
The question is asking for a graph that visualizes the greatest year-on-year percentage change in profits for each company listed. This requires calculating the percentage changes between the profits of adjacent years for each company and then identifying the highest percentage change for each.
Answer
The greatest percentage changes are: $2.5\%$ (A), $-3.43\%$ (B), $3.45\%$ (C), and $0.75\%$ (D).
Answer for screen readers
The greatest year-on-year percentage changes for each company are:
- Company A: $2.5%$
- Company B: $-3.43%$
- Company C: $3.45%$
- Company D: $0.75%$
Steps to Solve
- Calculate Year-on-Year Changes for Each Company
For each company, calculate the year-on-year percentage change using the formula:
$$ \text{Percentage Change} = \left( \frac{\text{Profit in current year} - \text{Profit in previous year}}{\text{Profit in previous year}} \right) \times 100 $$
-
Conduct Calculations for Each Company
-
Company A:
-
From Year 1 to Year 2: $$ \frac{533 - 520}{520} \times 100 = 2.5% $$
-
From Year 2 to Year 3: $$ \frac{544 - 533}{533} \times 100 = 2.06% $$
-
From Year 3 to Year 4: $$ \frac{531 - 544}{544} \times 100 = -2.39% $$
-
Greatest Change: $2.5%$
-
-
Company B:
-
From Year 1 to Year 2: $$ \frac{338 - 350}{350} \times 100 = -3.43% $$
-
From Year 2 to Year 3: $$ \frac{325 - 338}{338} \times 100 = -3.84% $$
-
From Year 3 to Year 4: $$ \frac{312 - 325}{325} \times 100 = -4.00% $$
-
Greatest Change: $-3.43%$
-
-
Company C:
-
From Year 1 to Year 2: $$ \frac{600 - 620}{620} \times 100 = -3.23% $$
-
From Year 2 to Year 3: $$ \frac{579 - 600}{600} \times 100 = -3.50% $$
-
From Year 3 to Year 4: $$ \frac{599 - 579}{579} \times 100 = 3.45% $$
-
Greatest Change: $3.45%$
-
-
Company D:
-
From Year 1 to Year 2: $$ \frac{401 - 398}{398} \times 100 = 0.75% $$
-
From Year 2 to Year 3: $$ \frac{402 - 401}{401} \times 100 = 0.25% $$
-
From Year 3 to Year 4: $$ \frac{406 - 402}{402} \times 100 = 0.99% $$
-
Greatest Change: $0.75%$
-
-
-
Identify Overall Greatest Year-on-Year Percentage Changes
- Company A: $2.5%$
- Company B: $-3.43%$
- Company C: $3.45%$
- Company D: $0.75%$
-
Prepare Data for Graph
Create a dataset for plotting:
| Company | Greatest Percentage Change |
|---|---|
| A | 2.5 |
| B | -3.43 |
| C | 3.45 |
| D | 0.75 |
- Plot the Graph
Using a bar graph, plot the 'Company' on the x-axis and 'Greatest Percentage Change' on the y-axis.
The greatest year-on-year percentage changes for each company are:
- Company A: $2.5%$
- Company B: $-3.43%$
- Company C: $3.45%$
- Company D: $0.75%$
More Information
Visualizing these changes in a graph can show how each company's profits fluctuate over the years, highlighting trends in profitability.
Tips
- Forgetting to convert the percentage change into a positive value when comparing gains.
- Confusing the direction of change (increase vs. decrease) when calculating percentage change.
AI-generated content may contain errors. Please verify critical information