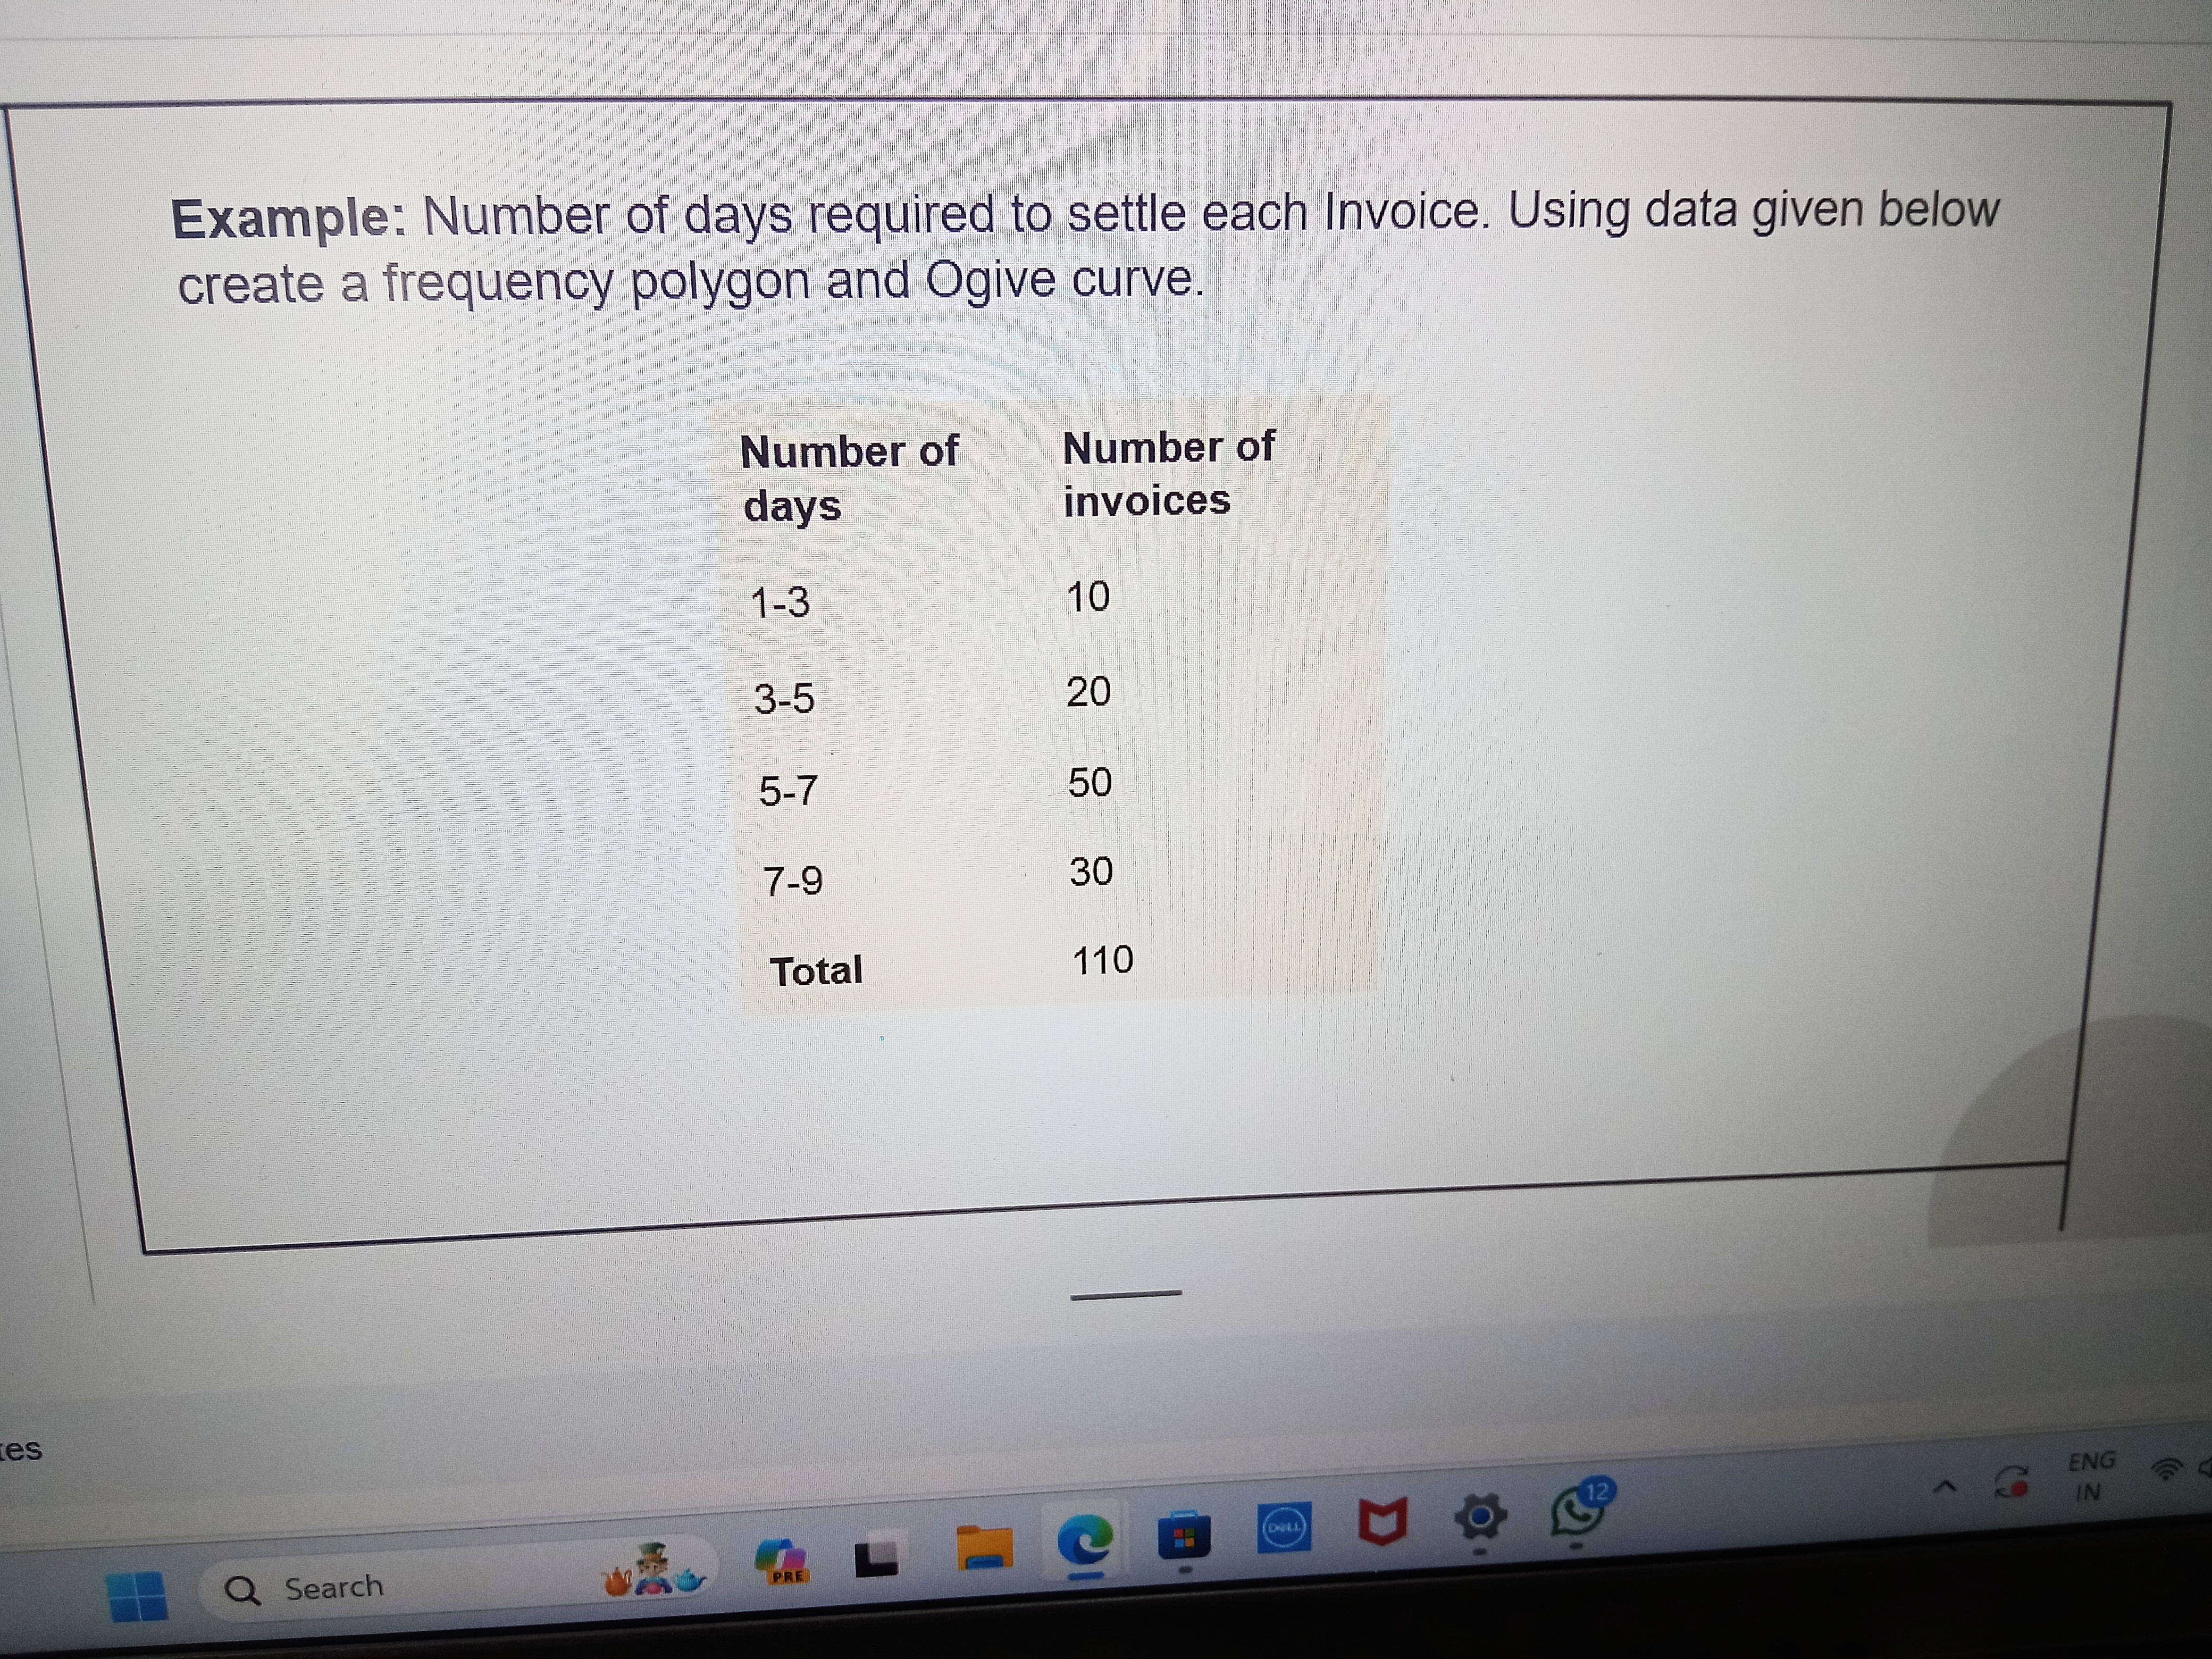
Number of days required to settle each invoice. Using the data given below, create a frequency polygon and Ogive curve.

Understand the Problem
The question requires the construction of a frequency polygon and an Ogive curve using the provided data on the number of days required to settle invoices and the corresponding number of invoices.
Answer
Plot the frequency polygon with midpoints (2, 10), (4, 20), (6, 50), and (8, 30), and the Ogive with cumulative frequencies (3, 10), (5, 30), (7, 80), and (9, 110).
Answer for screen readers
The frequency polygon and Ogive can be plotted using the midpoints and cumulative frequencies calculated.
Steps to Solve
-
Organize the Data
We start by summarizing the data into intervals and their corresponding frequencies:
- 1-3 days: 10 invoices
- 3-5 days: 20 invoices
- 5-7 days: 50 invoices
- 7-9 days: 30 invoices
-
Calculate Class Midpoints
For each interval, calculate the class midpoint, which will be used for plotting:
- Midpoint for 1-3 days = $(1 + 3)/2 = 2$
- Midpoint for 3-5 days = $(3 + 5)/2 = 4$
- Midpoint for 5-7 days = $(5 + 7)/2 = 6$
- Midpoint for 7-9 days = $(7 + 9)/2 = 8$
-
Create a Frequency Table
Construct a table with midpoints and frequencies:
Midpoint Frequency 2 10 4 20 6 50 8 30 -
Plotting the Frequency Polygon
On graph paper or graphing software, plot the midpoints against their frequencies, and connect the points with straight lines. You should plot the point for (0 days, 0 invoices) to start and (9 days, 0 invoices) to end the polygon.
-
Calculate Cumulative Frequencies
To create an Ogive, calculate the cumulative frequency:
- Up to 3 days: 10
- Up to 5 days: $10 + 20 = 30$
- Up to 7 days: $30 + 50 = 80$
- Up to 9 days: $80 + 30 = 110$
-
Create a Cumulative Frequency Table
Class Interval Cumulative Frequency 1-3 10 3-5 30 5-7 80 7-9 110 -
Plotting the Ogive
Similar to the frequency polygon, plot the cumulative frequency against the upper class boundaries. Connect the points with straight lines. Include the point (9 days, 110 invoices) at the top right.
The frequency polygon and Ogive can be plotted using the midpoints and cumulative frequencies calculated.
More Information
Frequency polygons provide a visual representation of data distribution, while the Ogive shows cumulative frequencies, useful for understanding how data accumulates over intervals.
Tips
- Forgetting to include the starting (0,0) point for the frequency polygon.
- Not using upper class boundaries when plotting the Ogive.
- Mistaking midpoints for frequencies.
AI-generated content may contain errors. Please verify critical information