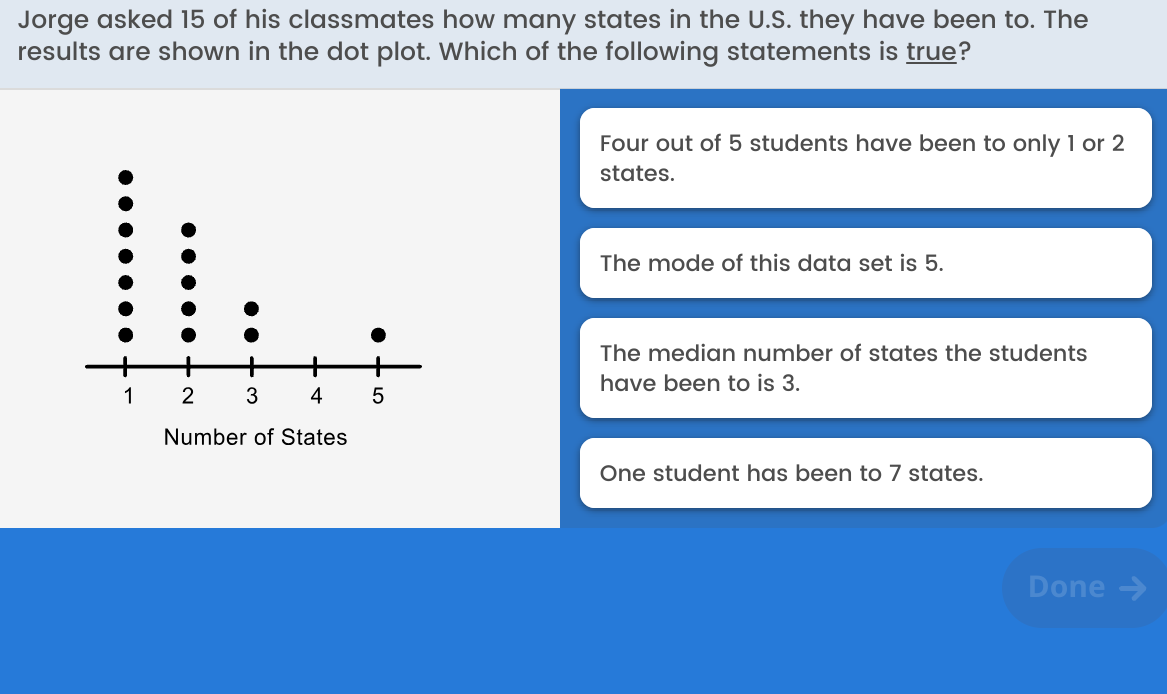
Jorge asked 15 of his classmates how many states in the U.S. they have been to. The results are shown in the dot plot. Which of the following statements is true? Four out of 5 stud... Jorge asked 15 of his classmates how many states in the U.S. they have been to. The results are shown in the dot plot. Which of the following statements is true? Four out of 5 students have been to only 1 or 2 states. The mode of this data set is 5. The median number of states the students have been to is 3. One student has been to 7 states.

Understand the Problem
The question asks which of the statements about the number of states visited by students, as shown in the dot plot, is true. To solve this, we need to analyze the dot plot and calculate relevant statistics like mode and median.
Answer
All statements are false.
Answer for screen readers
All statements are false.
Steps to Solve
-
Counting the Dots for Each Value
From the dot plot, count the number of dots over each number of states:
- 1 state: 6 dots
- 2 states: 4 dots
- 3 states: 2 dots
- 4 states: 1 dot
- 5 states: 1 dot
-
Finding the Mode
The mode is the number that appears most frequently. In this case:
- The number with the most dots is 1 state (6 dots).
- Therefore, the mode is 1.
-
Finding the Median
To find the median, first list out all the numbers of states in order based on the dot counts: $$ 1, 1, 1, 1, 1, 1, 2, 2, 2, 2, 3, 3, 4, 5 $$
The total number of responses is 15 (an odd number). To find the median, locate the middle value (the 8th value):
- The 8th value in the ordered list is 2.
- Therefore, the median is 2.
-
Evaluating the Statements
Now, evaluate the truth of each statement:
- Statement 1: Four out of 5 students have been to only 1 or 2 states. (False, since 6 have been to 1 and 4 to 2)
- Statement 2: The mode of this data set is 5. (False, the mode is 1)
- Statement 3: The median number of states the students have been to is 3. (False, the median is 2)
- Statement 4: One student has been to 7 states. (False, there’s no mention of 7 states in the dot plot)
-
Conclusion
All presented statements are false.
All statements are false.
More Information
The mode and median are commonly used measures in statistics. The mode tells us the most frequent response, while the median indicates the middle value in an ordered dataset. Understanding these concepts helps interpret data effectively.
Tips
- Confusing mode with median.
- Miscounting the dots in the dot plot.
- Assuming values not represented in the plot (like 7 states) are possible.
AI-generated content may contain errors. Please verify critical information