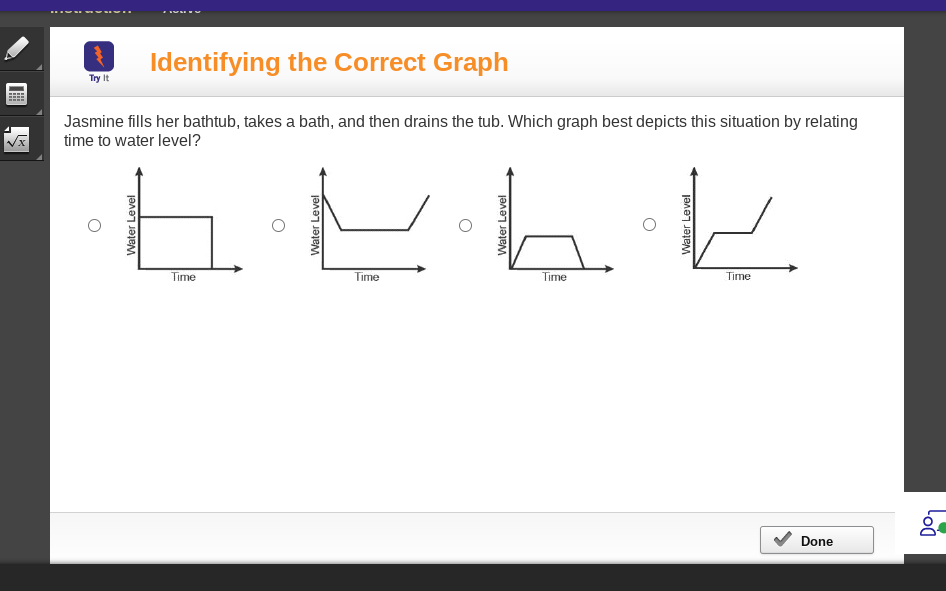
Jasmine fills her bathtub, takes a bath, and then drains the tub. Which graph best depicts this situation by relating time to water level?

Understand the Problem
The question is asking us to identify which graph accurately represents the situation where Jasmine fills her bathtub, takes a bath, and then drains it. This involves understanding how the water level changes over time through filling, usage, and draining.
Answer
Choose the graph that rises, levels, then drops.
The graph that initially rises, stays constant, then decreases represents Jasmine's actions.
Answer for screen readers
The graph that initially rises, stays constant, then decreases represents Jasmine's actions.
More Information
The graph visually demonstrates the sequential process of filling, using, and draining the bathtub.
Tips
Ensure the stages in the graph accurately represent filling, steady level, and draining without adding unexpected sections.
Sources
- Identifying the Correct Graph time to water level? - gauthmath.com
- Jasmine fills her bathtub, takes a bath, and then drains the ... - Gauth - gauthmath.com