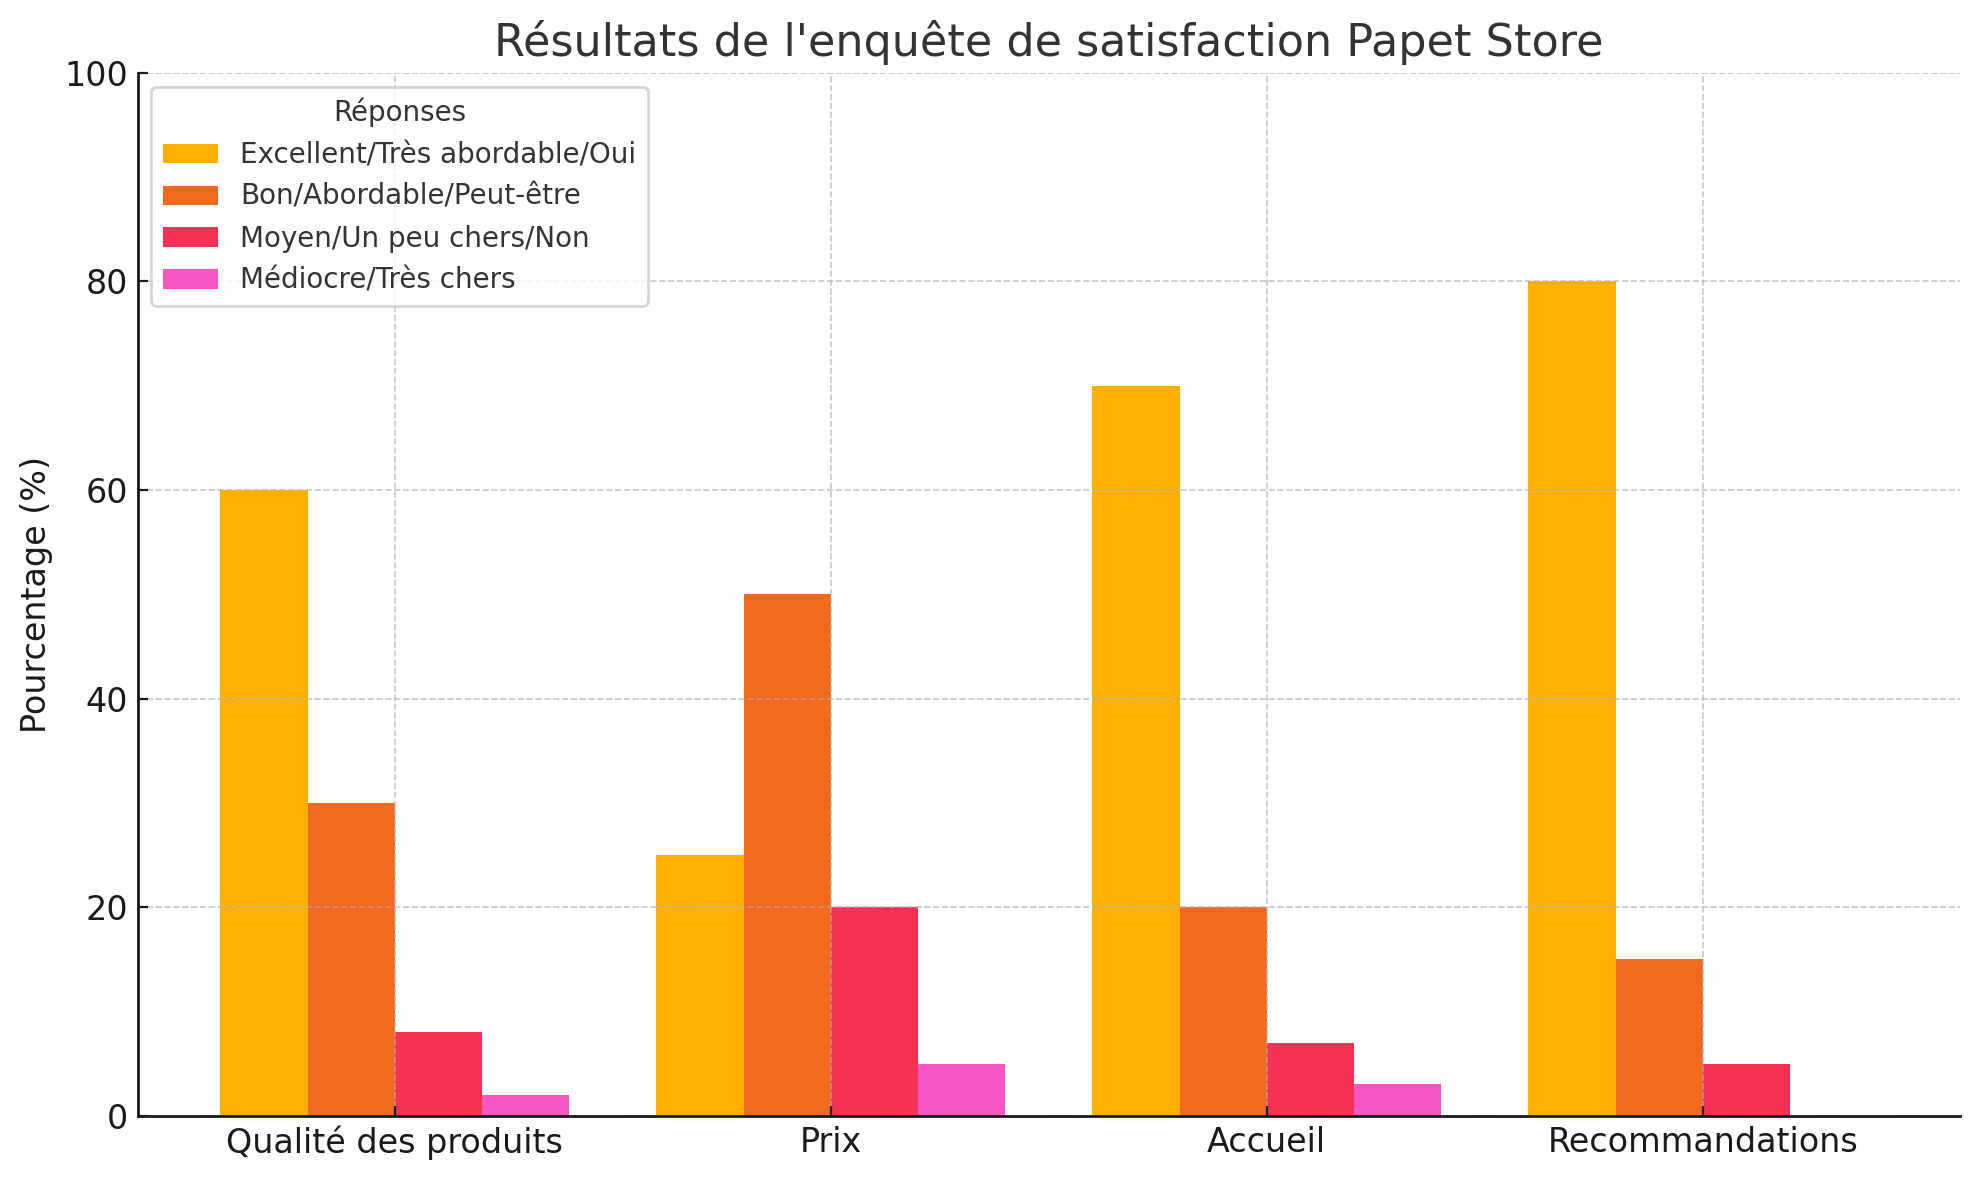
Interpréter le graphique des résultats de l'enquête de satisfaction Papet Store.

Understand the Problem
La question porte sur l'interprétation d'un graphique représentant les résultats d'une enquête de satisfaction pour un Papet Store, en mettant l'accent sur différents critères comme la qualité des produits, les prix, l'accueil et les recommandations.
Answer
High satisfaction in quality and recommendations; concerns with pricing.
The graph shows most satisfaction for product quality and recommendations, less for prices.
Answer for screen readers
The graph shows most satisfaction for product quality and recommendations, less for prices.
More Information
The survey indicates strong positive feedback for the quality of products and likelihood of recommendation, highlighting areas of improvement mainly in pricing.
Tips
Be careful not to overlook smaller segments that may indicate areas for improvement.
AI-generated content may contain errors. Please verify critical information