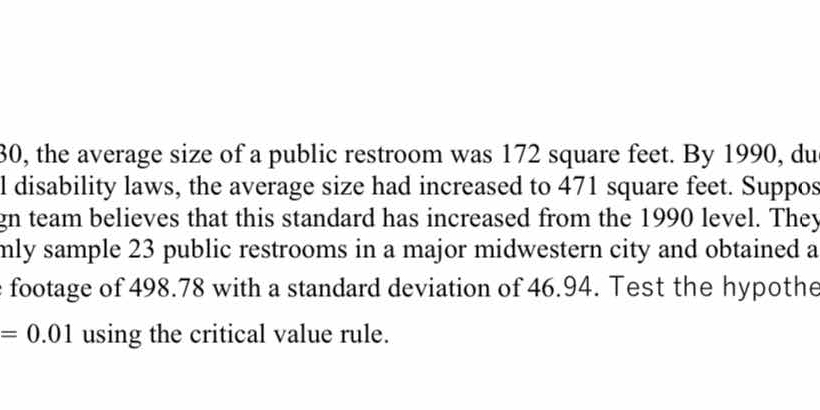
In 1930, the average size of a public restroom was 172 square feet. By 1990, due to disability laws, the average size had increased to 471 square feet. Suppose a design team believ... In 1930, the average size of a public restroom was 172 square feet. By 1990, due to disability laws, the average size had increased to 471 square feet. Suppose a design team believes that this standard has increased from the 1990 level. They randomly sample 23 public restrooms in a major midwestern city and obtained a mean footage of 498.78 with a standard deviation of 46.94. Test the hypothesis at alpha = 0.01 using the critical value rule.

Understand the Problem
The question is asking to conduct a hypothesis test to determine if the average size of public restrooms has increased from the 1990 level of 471 square feet, based on a sample of 23 restrooms with a calculated mean size and standard deviation. We will apply the critical value rule at a significance level of 0.01.
Answer
The average size of public restrooms has significantly increased; $t \approx 2.84$, reject $H_0$.
Answer for screen readers
The test statistic is approximately $t \approx 2.84$. Therefore, we reject the null hypothesis.
Steps to Solve
-
Set Up the Hypotheses
We begin by establishing the null and alternative hypotheses.
- Null Hypothesis ($H_0$): The average size of public restrooms is equal to 471 square feet.
- Alternative Hypothesis ($H_a$): The average size of public restrooms is greater than 471 square feet.
-
Determine the Significance Level
The significance level for this hypothesis test is given as $\alpha = 0.01$.
-
Find the Critical Value
Since this is a one-tailed test (we are checking if it's greater), we need to find the critical value using the $t$-distribution. With 22 degrees of freedom ($n - 1 = 23 - 1 = 22$) and $\alpha = 0.01$:
- Lookup the critical value for $t$ in a $t$-table, which gives us approximately $t_{critical} \approx 2.508$.
-
Calculate the Test Statistic
The test statistic ($t$) can be calculated using the formula: $$ t = \frac{\bar{x} - \mu_0}{\frac{s}{\sqrt{n}}} $$ Where:
- $\bar{x} = 498.78$ (sample mean)
- $\mu_0 = 471$ (population mean under null)
- $s = 46.94$ (sample standard deviation)
- $n = 23$ (sample size)
Plugging in the values: $$ t = \frac{498.78 - 471}{\frac{46.94}{\sqrt{23}}} $$
Calculate the standard error: $$ SE = \frac{46.94}{\sqrt{23}} \approx 9.78 $$
Therefore: $$ t = \frac{27.78}{9.78} \approx 2.84 $$
-
Make the Decision
Now we compare the calculated $t$ statistic (2.84) to the critical value (2.508).
- Since $2.84 > 2.508$, we reject the null hypothesis at the 0.01 significance level.
The test statistic is approximately $t \approx 2.84$. Therefore, we reject the null hypothesis.
More Information
Rejecting the null hypothesis suggests that there is significant evidence to support the claim that the average size of public restrooms has indeed increased from the 1990 level of 471 square feet.
Tips
- Misinterpreting the direction of the test: Ensure you are clear whether the test is one-tailed or two-tailed based on the research question. In this case, it's a one-tailed test since we only care if the mean has increased.
- Incorrectly calculating the standard error: It’s crucial to correctly compute the standard error using the sample standard deviation and size.
AI-generated content may contain errors. Please verify critical information