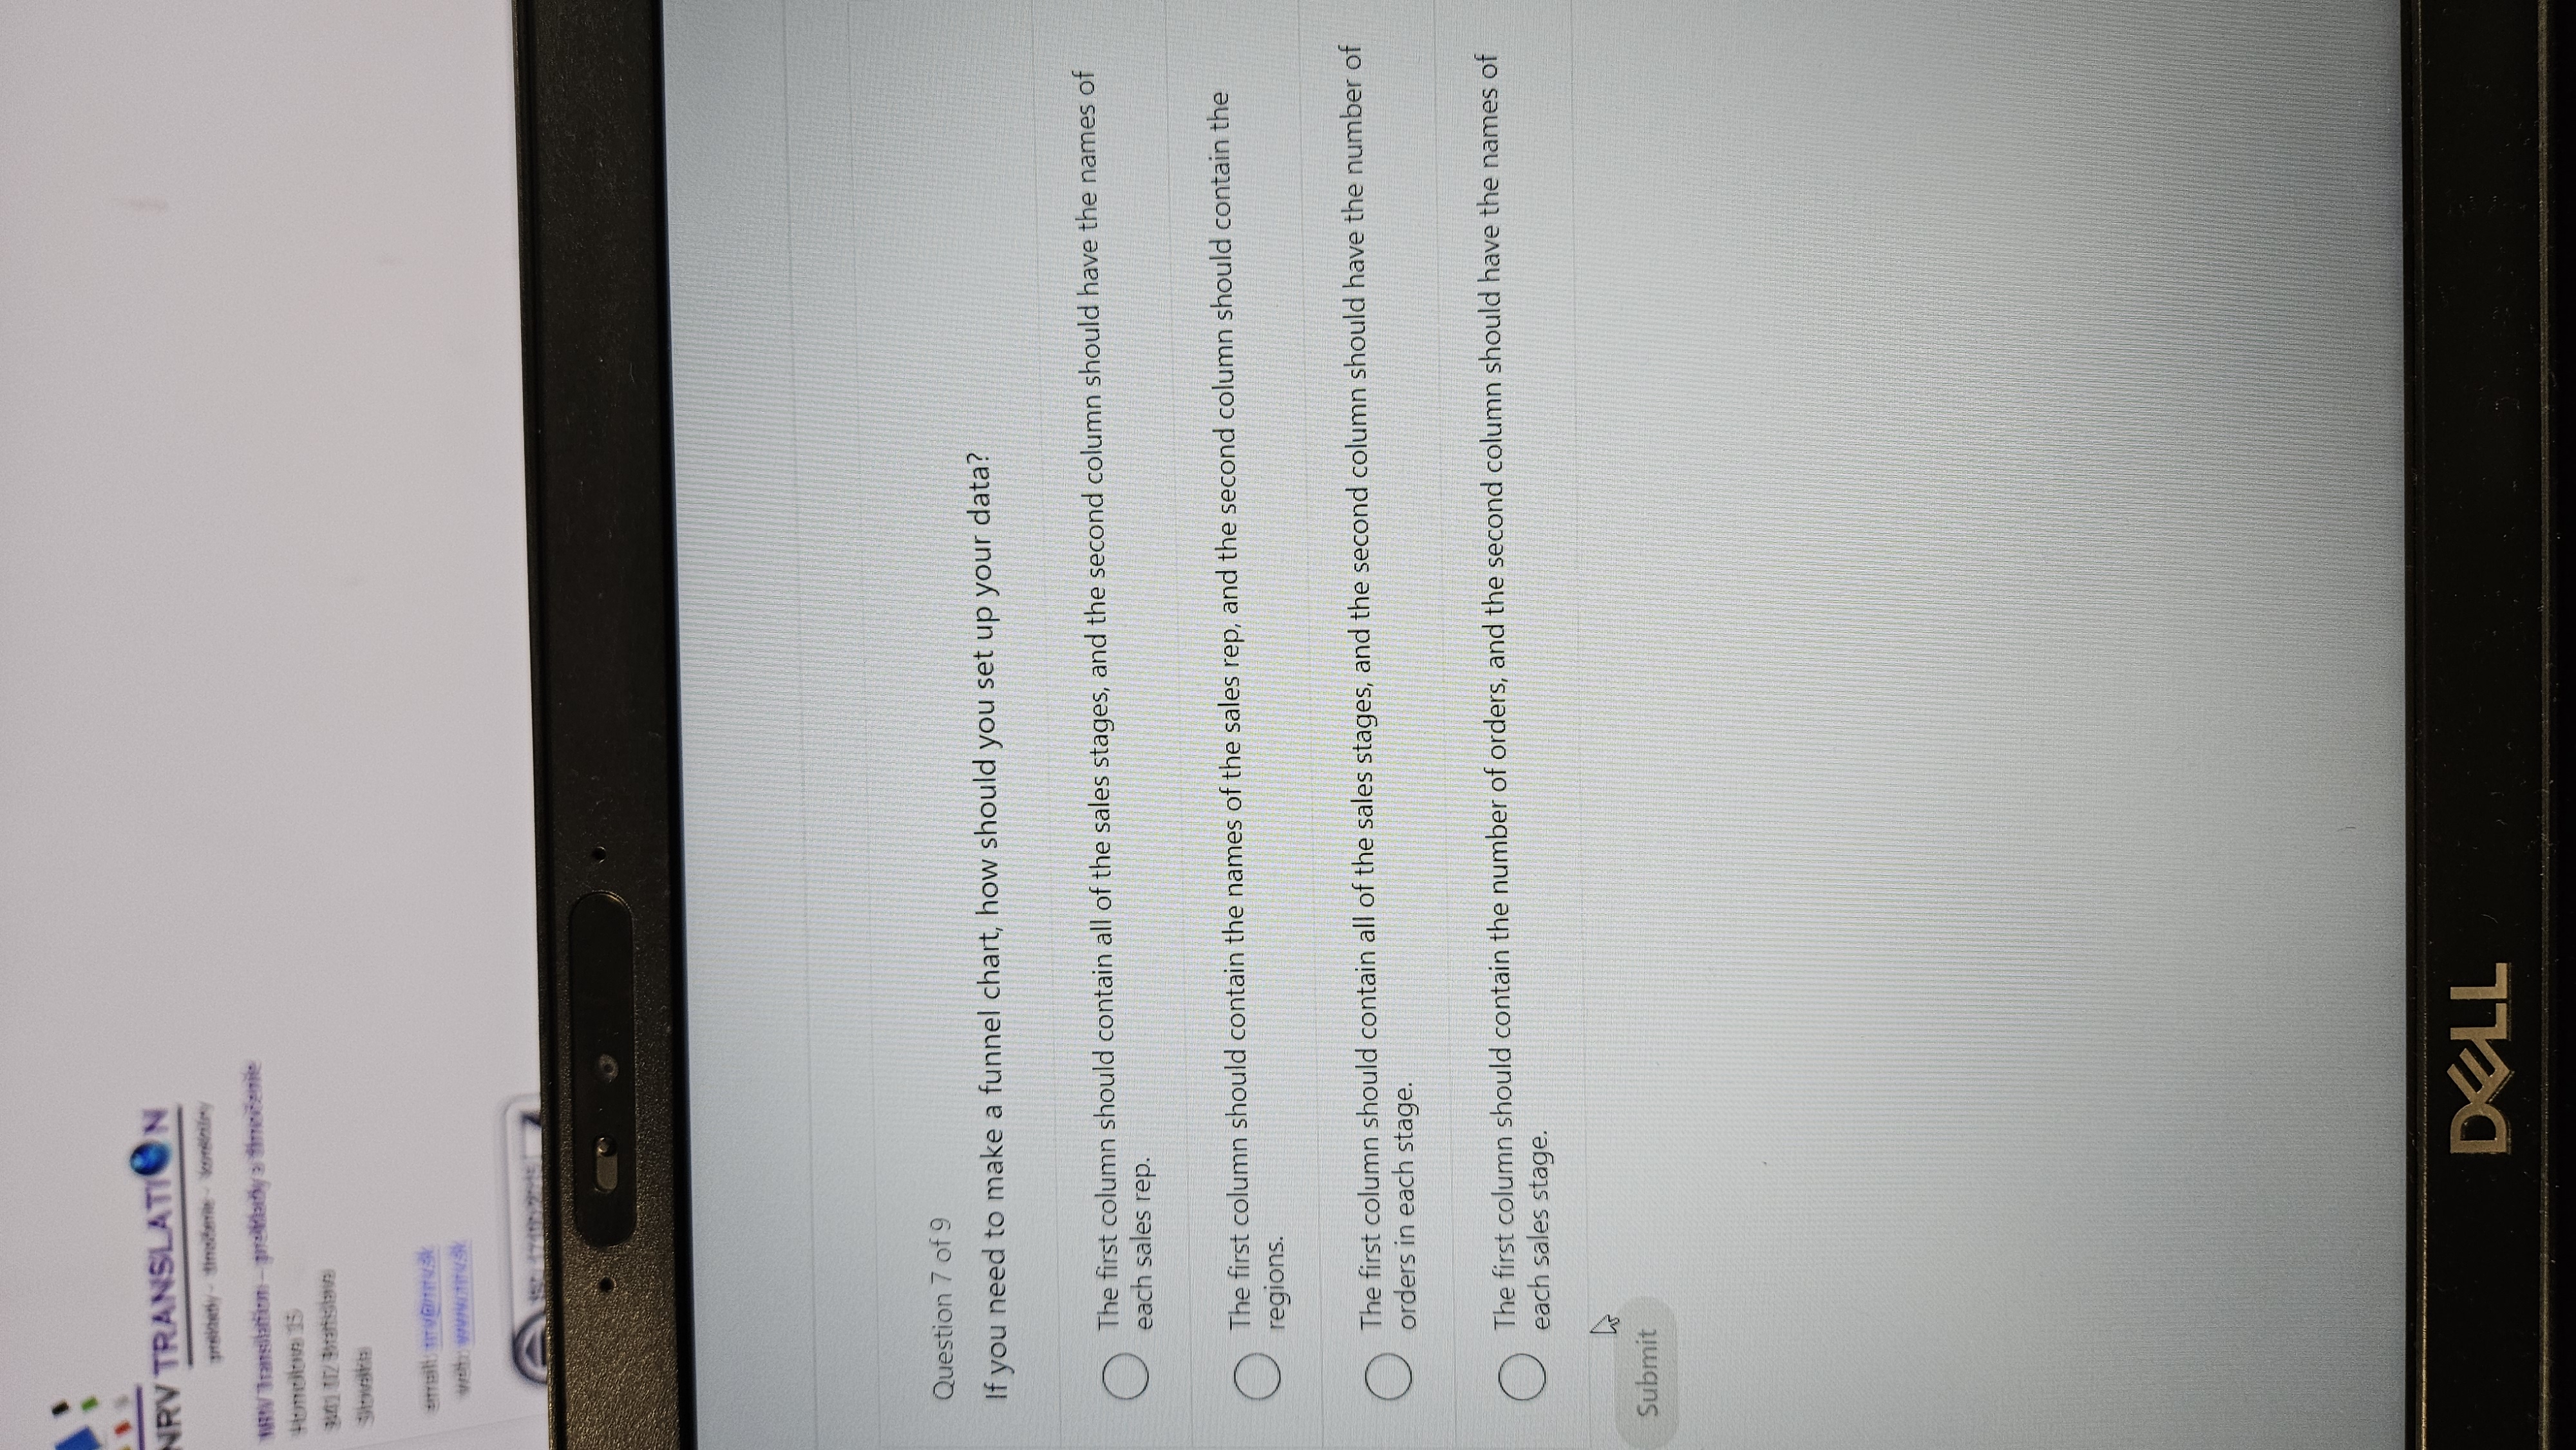
If you need to make a funnel chart, how should you set up your data?

Understand the Problem
The question is asking how to structure data for creating a funnel chart, which is typically used to represent different stages in a process. The options provided suggest different organizational formats for arranging sales stages and associated data.
Answer
Column 1: Sales stages; Column 2: Number of orders in each stage.
The first column should contain all of the sales stages, and the second column should have the number of orders in each stage.
Answer for screen readers
The first column should contain all of the sales stages, and the second column should have the number of orders in each stage.
More Information
Funnel charts visualize stages in a process, useful for showing data at each stage like sales funnels, and emphasize drop-off points.
Tips
Ensure each stage is accurately represented; mislabeling can lead to misinterpretation.
Sources
- A Guide to Funnel Charts (With How To Create One) | Indeed.com - indeed.com
- A Complete Guide to Funnel Charts | Atlassian - atlassian.com