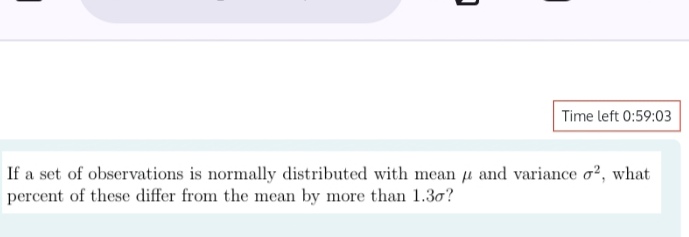
If a set of observations is normally distributed with mean μ and variance σ², what percent of these differ from the mean by more than 1.3σ?

Understand the Problem
The question is asking for the percentage of observations in a normally distributed dataset that deviate from the mean by more than 1.3 standard deviations. This requires understanding properties of the normal distribution and calculating the relevant probabilities.
Answer
Approximately $19.36\%$ of observations differ from the mean by more than $1.3\sigma$.
Answer for screen readers
Approximately $19.36%$ of the observations differ from the mean by more than $1.3\sigma$.
Steps to Solve
-
Understanding the normal distribution
The question involves a normally distributed dataset, characterized by its mean ($\mu$) and variance ($\sigma^2$). The standard deviation ($\sigma$) is the square root of variance. -
Determining the Z-scores
To find the percentage of observations that differ from the mean by more than 1.3 standard deviations, we can calculate the Z-scores. The Z-score is calculated using the formula: $$ Z = \frac{X - \mu}{\sigma} $$
For this problem, we are interested in $Z = \pm 1.3$, which means $X$ can be greater than $\mu + 1.3\sigma$ or less than $\mu - 1.3\sigma$. -
Using the standard normal distribution table
Look up the Z-scores in a standard normal distribution (Z) table. The table provides the area to the left of a given Z-score. For $Z = 1.3$, the corresponding area is approximately 0.9032. -
Calculating the tails
Since we want the area in both tails (greater than 1.3 and less than -1.3), we need to find: $$ P(Z > 1.3) + P(Z < -1.3) $$
This can be found by calculating: $$ P(Z < -1.3) = 1 - P(Z < 1.3) $$ $$ P(Z > 1.3) = 1 - 0.9032 $$ -
Final percentage calculation
Now calculate both tails:
- For $Z > 1.3$: $$ P(Z > 1.3) \approx 1 - 0.9032 = 0.0968 $$
- For $Z < -1.3$:
$$ P(Z < -1.3) \approx 0.0968 $$
Adding those together, the total probability is: $$ P(Z < -1.3) + P(Z > 1.3) = 0.0968 + 0.0968 = 0.1936 $$
To convert to a percentage, multiply by 100: $$ 0.1936 \times 100 \approx 19.36% $$
Approximately $19.36%$ of the observations differ from the mean by more than $1.3\sigma$.
More Information
This percentage represents the proportion of observations within a normal distribution that lie outside the interval defined by $1.3$ standard deviations from the mean. In practical applications, this can help in understanding variability and outliers in datasets.
Tips
- Forgetting to account for both tails of the distribution when calculating the percentage of observations that deviate from the mean.
- Misinterpreting Z-scores or using incorrect values from the Z-table.
AI-generated content may contain errors. Please verify critical information