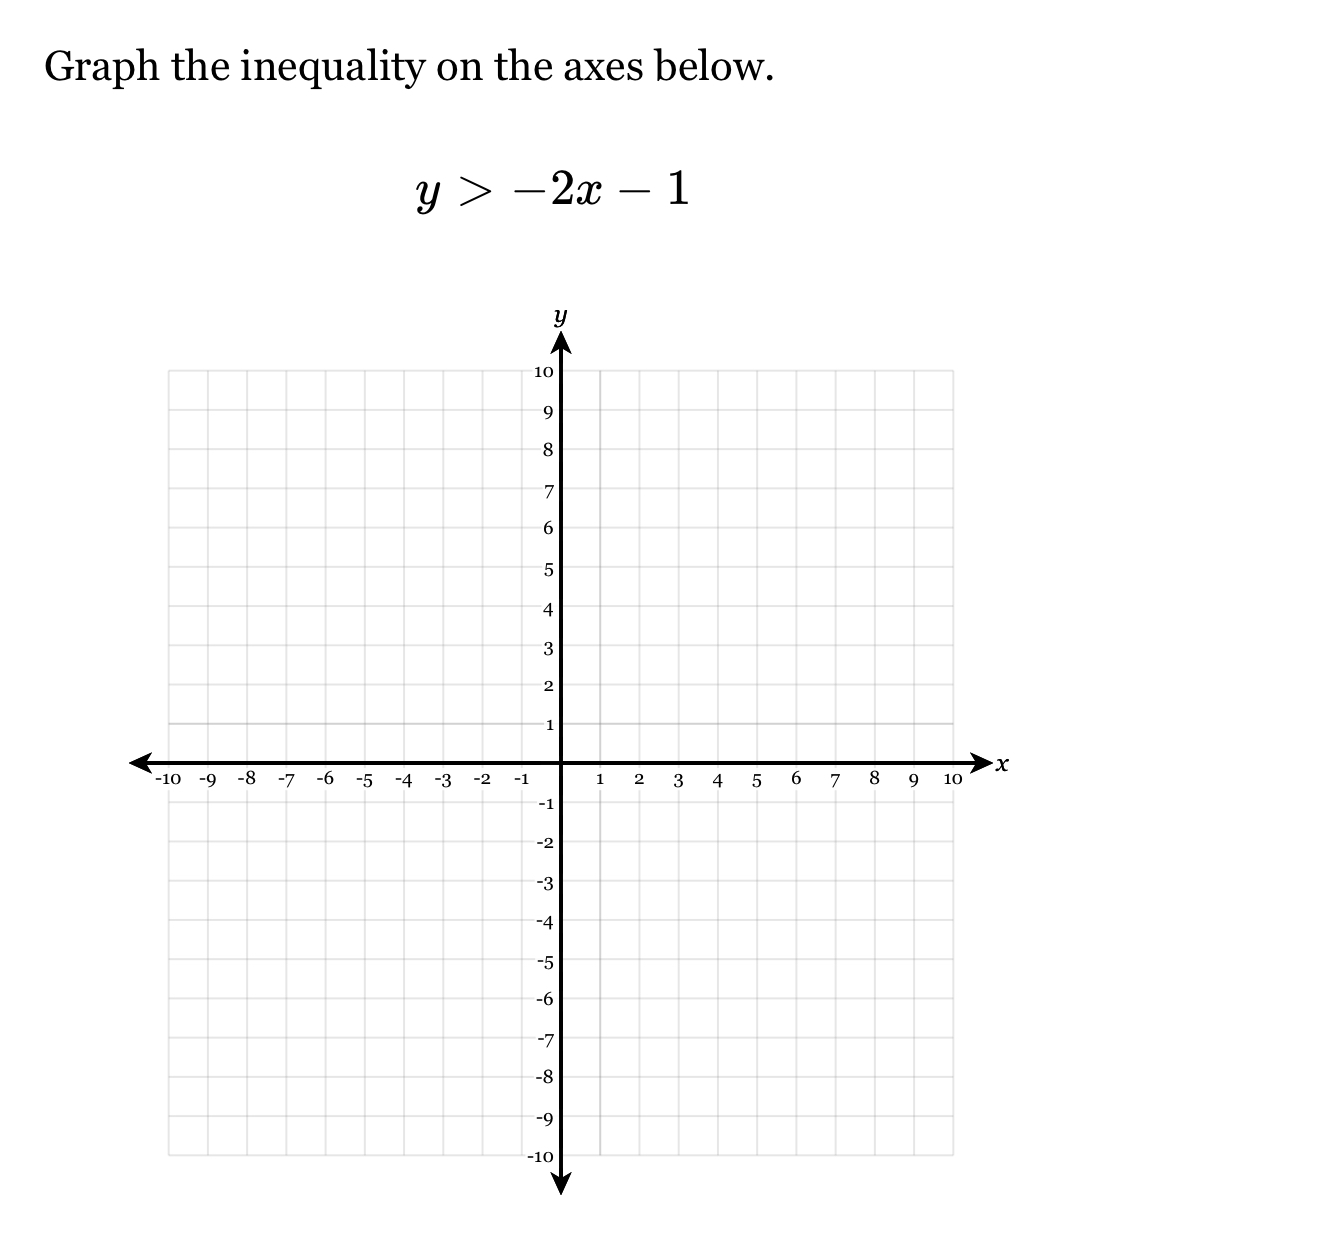
Graph the inequality y > -2x - 1.

Understand the Problem
The question is asking to graph the inequality y > -2x - 1 on a coordinate grid. To solve it, we first need to find the boundary line by graphing y = -2x - 1, using a dashed line since the inequality is strict (greater than). Then, we will shade the region above the line to represent all points where y is greater than -2x - 1.
Answer
The shaded region is above the dashed line representing the inequality $y > -2x - 1$.
Answer for screen readers
The graph of the inequality $y > -2x - 1$ shows a dashed line through the points (0, -1) and (-0.5, 0), with the region above the line shaded.
Steps to Solve
-
Identify the Boundary Line
Start with the equation that defines the boundary: $y = -2x - 1$. This is a straight line, which will help us understand where the inequality applies.
-
Graph the Boundary Line
We can find the y-intercept and x-intercept of the line.
-
Y-intercept: Set $x = 0$: $$ y = -2(0) - 1 = -1 $$ So the point (0, -1) is on the line.
-
X-intercept: Set $y = 0$: $$ 0 = -2x - 1 \implies 2x = -1 \implies x = -\frac{1}{2} $$ So the point (-0.5, 0) is on the line.
Now plot these two points: (0, -1) and (-0.5, 0), and draw a dashed line through them (indicating that the line itself is not included in the solution).
-
-
Determine the Shaded Region
Since the inequality is $y > -2x - 1$, we need to shade the area above the dashed line. This area represents all the (x, y) points that satisfy the inequality.
-
Check a Test Point
To verify that the correct area is shaded, choose a simple test point not on the line, such as (0, 0): $$ 0 > -2(0) - 1 \implies 0 > -1 $$ This is true, confirming that the region above the line is correctly shaded.
The graph of the inequality $y > -2x - 1$ shows a dashed line through the points (0, -1) and (-0.5, 0), with the region above the line shaded.
More Information
The inequality represents all the points where the y-value is greater than the corresponding value on the line $y = -2x - 1$. This concept is fundamental in algebra and is useful in various fields such as optimization and economics.
Tips
- Forgetting to use a dashed line instead of a solid line for strict inequalities.
- Shading the wrong side of the line; always double-check by testing a point not on the line.
AI-generated content may contain errors. Please verify critical information