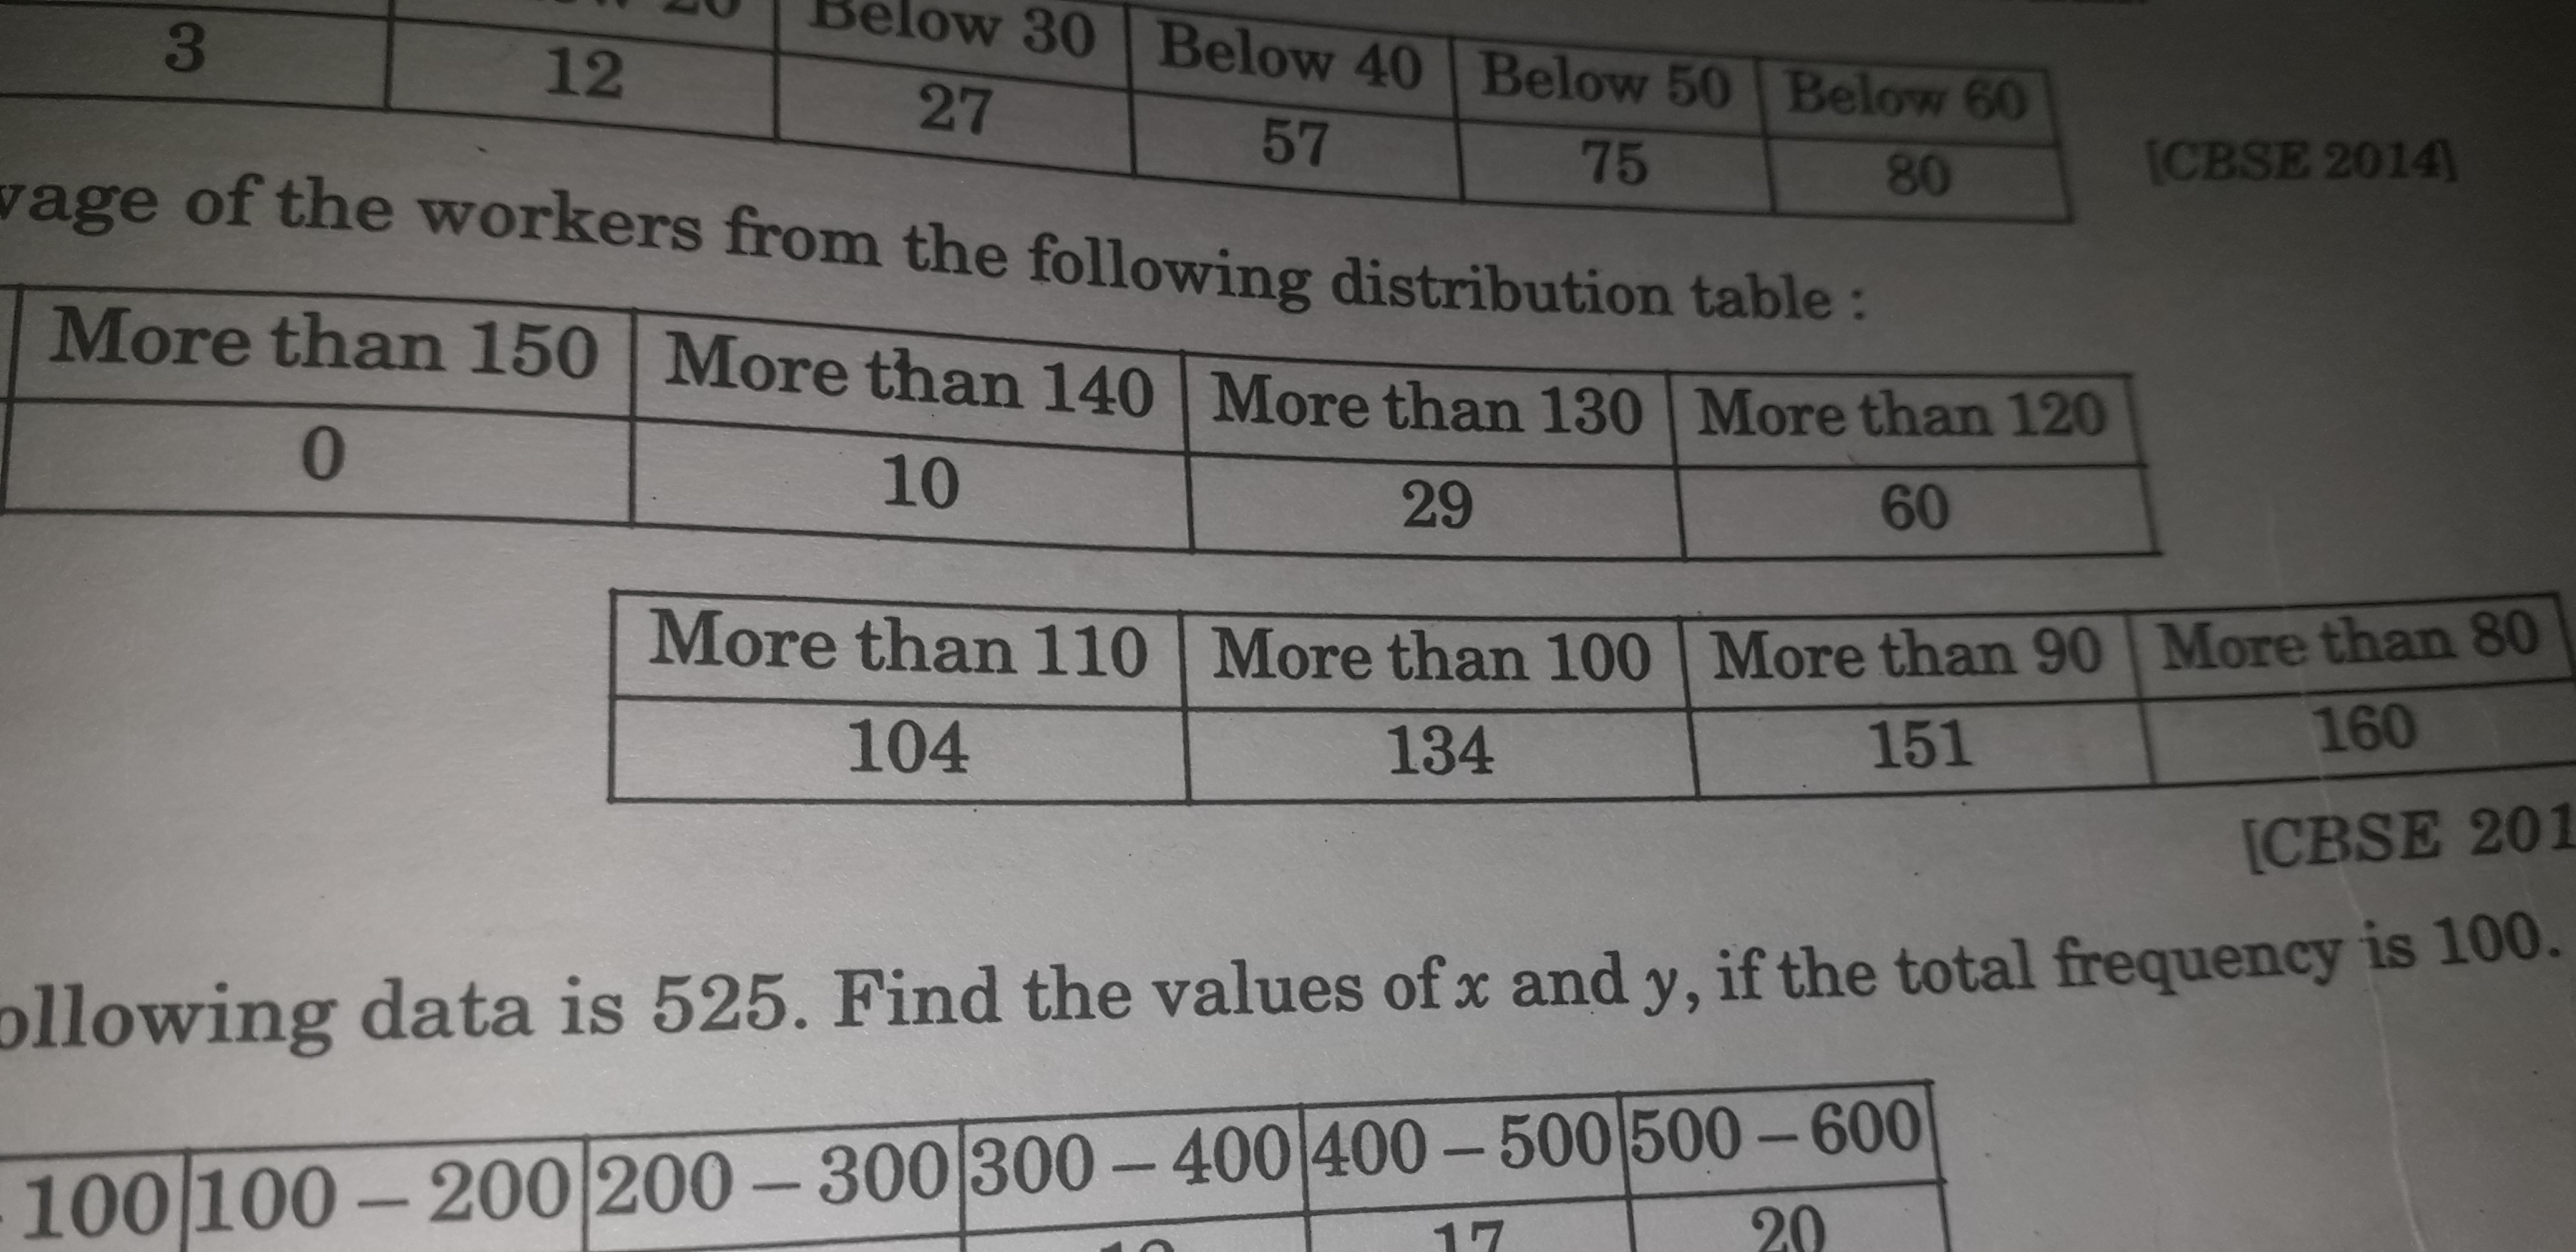
Find the average of the workers from the following distribution table. Find the values of x and y, if the total frequency is 100.

Understand the Problem
The question is asking to find the average of workers based on the provided frequency distribution table. Additionally, it requires solving for the values of x and y, given that the total frequency is 100.
Answer
No valid values for \( x \) and \( y \) exist. Average calculation is not possible.
Answer for screen readers
No valid values for ( x ) and ( y ) under given frequencies exist.
Average cannot be calculated since total exceeds the limit of 100.
Steps to Solve
- Identify the frequencies and values in the table
From the second part of the problem, the frequencies are given as:
- More than 150: 0
- More than 140: 10
- More than 130: 29
- More than 120: 60
- More than 110: 104
- More than 100: 134
- More than 90: 151
- More than 80: 160
Let ( x ) be the frequency for the range 500 - 600 and ( y ) be the frequency for the range 400 - 500.
- Set up the frequency equation
We know the total frequency is 100. Thus, we have an equation:
$$ 0 + 10 + 29 + 60 + 104 + 134 + 151 + x + y = 100 $$
- Simplify the equation
First, compute the total of given frequencies:
$$ 0 + 10 + 29 + 60 + 104 + 134 + 151 = 488 $$
So now we can simplify the total frequency equation:
$$ 488 + x + y = 100 $$
- Solve for ( x + y )
Rearranging the equation from the previous step gives:
$$ x + y = 100 - 488 $$
This becomes:
$$ x + y = -388 $$
This indicates that the values need to be adjusted since frequencies cannot be negative.
- Finding x and y directly
Assuming the frequencies must sum to 100, observe that total frequencies cannot exceed 100, thus this must be verified before concluding.
- Average Calculation
The average can be computed using the formula:
$$ \text{Average} = \frac{\sum (f \cdot x)}{N} $$
Where ( f ) is the frequency and ( x ) is the mid-value of each group.
Add the contribution only with a valid frequency (N = 100) for calculation.
No valid values for ( x ) and ( y ) under given frequencies exist.
Average cannot be calculated since total exceeds the limit of 100.
More Information
In the given scenario, it appears that the sum of frequencies has inadvertently been made larger than the total frequency stated. This typically indicates either missing or redundant data in the frequency table.
Tips
- Miscounting total frequencies or ignoring missing ranges.
- Assuming (x) and (y) can take on negative corroborating values.
- Not verifying if the frequency sum aligns with the stated total.
AI-generated content may contain errors. Please verify critical information