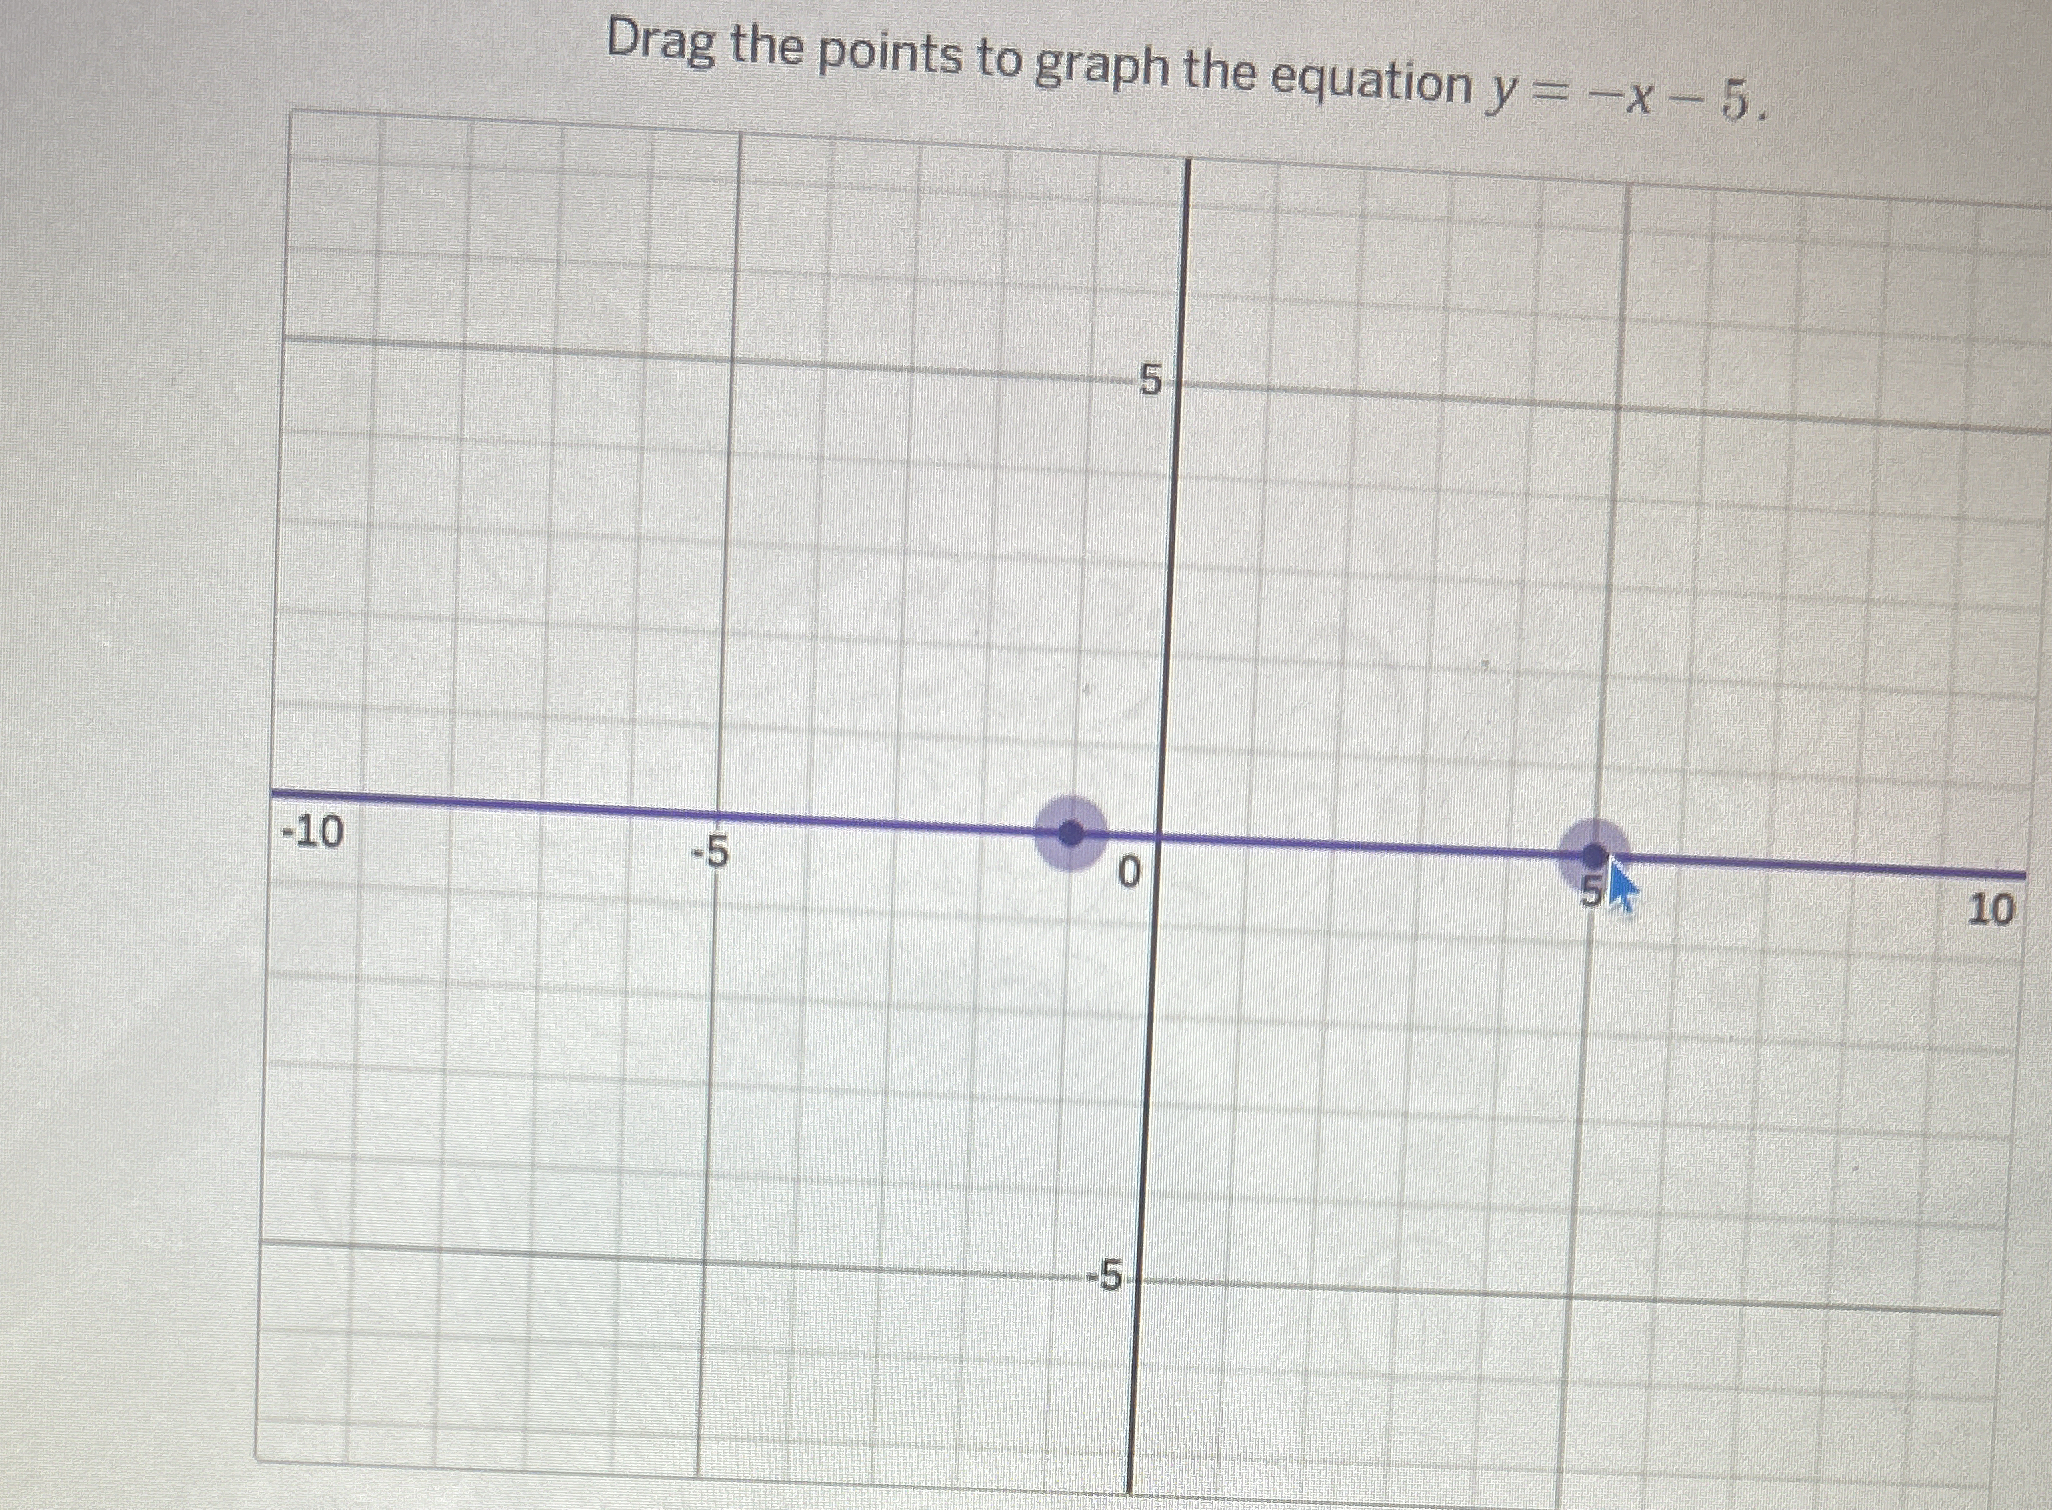
Drag the points to graph the equation y = -x - 5.

Understand the Problem
The question is asking for assistance in graphing the equation y = -x - 5 on a coordinate grid. The user is required to drag points to create the graph for this linear equation.
Answer
The line representing $y = -x - 5$ passes through points (0, -5) and (1, -6).
Answer for screen readers
The graph of the equation $y = -x - 5$ consists of a straight line passing through the points (0, -5) and (1, -6).
Steps to Solve
-
Identify the Equation Type The equation given is $y = -x - 5$. This represents a linear equation where the slope is -1 and the y-intercept is -5.
-
Find the Y-Intercept The y-intercept is the point where the line crosses the y-axis. Set $x = 0$: $$ y = -0 - 5 \implies y = -5 $$ So the y-intercept is the point (0, -5).
-
Find Another Point Using the Slope The slope of the equation is -1, which means for every 1 unit increase in $x$, $y$ decreases by 1 unit.
Start from the y-intercept (0, -5):
- If $x = 1$, $$ y = -1 - 5 = -6 $$ So another point is (1, -6).
-
Plot the Points Now, plot the points (0, -5) and (1, -6) on the coordinate grid.
-
Draw the Line After plotting the two points, draw a straight line through them. This line represents the equation $y = -x - 5$.
The graph of the equation $y = -x - 5$ consists of a straight line passing through the points (0, -5) and (1, -6).
More Information
This linear equation exhibits a slope of -1, indicating that the line falls as you move from left to right. The y-intercept at (0, -5) is crucial for accurately plotting the graph.
Tips
- Confusing the slope and y-intercept, which may lead to incorrect graphing. Always ensure you accurately identify both points.
- Forgetting the direction of the slope. A negative slope means the line decreases.
AI-generated content may contain errors. Please verify critical information