Understand the Problem
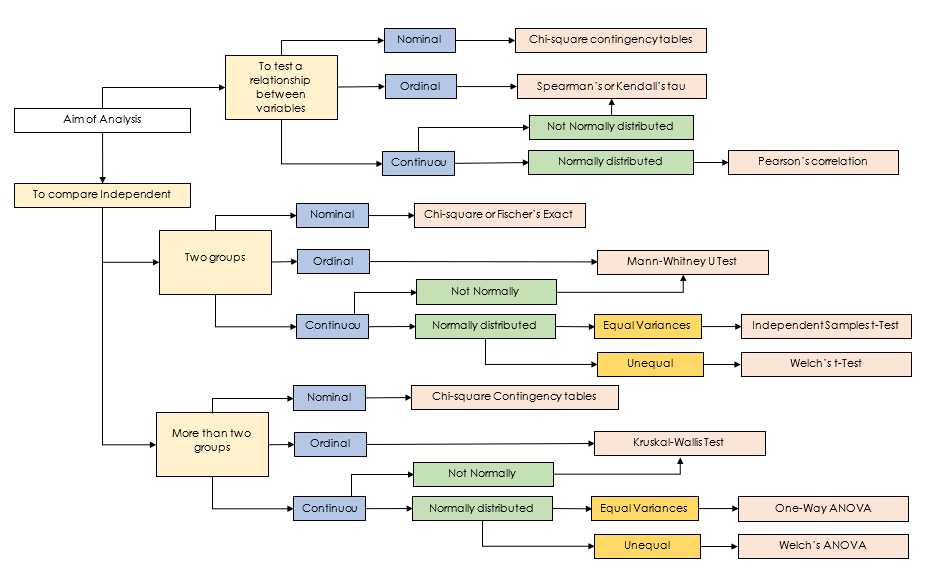
The image presents a decision tree for selecting statistical tests based on the types of data and distribution to compare independent groups. The flowchart guides the user through a series of choices based on whether the variables are nominal, ordinal, or continuous, and whether the data is normally distributed or not.
Answer
The diagram guides statistical test selection based on data types and analysis aims.
The diagram provides a guide for selecting statistical tests based on the type of data and analysis goals, such as comparing groups or testing relationships between variables.
Answer for screen readers
The diagram provides a guide for selecting statistical tests based on the type of data and analysis goals, such as comparing groups or testing relationships between variables.
More Information
This flowchart helps determine the appropriate statistical test based on the aim of analysis (comparison or relationship testing), the number of groups, data type (nominal, ordinal, continuous), and distribution characteristics.
AI-generated content may contain errors. Please verify critical information