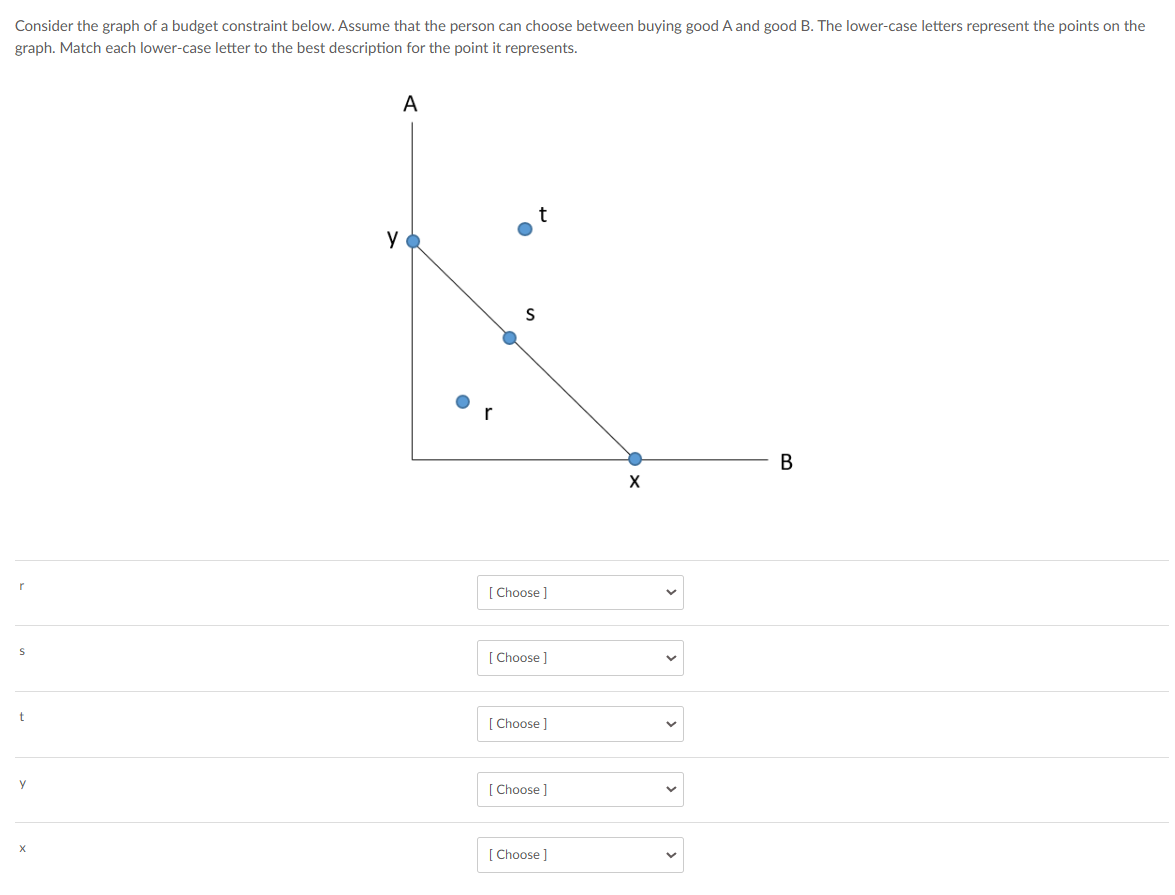
Consider the graph of a budget constraint below. Assume that the person can choose between buying good A and good B. The lower-case letters represent the points on the graph. Match... Consider the graph of a budget constraint below. Assume that the person can choose between buying good A and good B. The lower-case letters represent the points on the graph. Match each lower-case letter to the best description for the point it represents.

Understand the Problem
The question is asking about a budget constraint graph and requires matching points labeled with letters to their descriptions based on economic concepts. The high-level approach will involve identifying the significance of each point in the context of consumer choice between two goods.
Answer
'r' below line, 's' on line, 't' above line, 'y' max A, 'x' max B.
Point 'r' is below the budget line (underutilization), point 's' is on the budget line (efficient use), point 't' is above the budget line (exceeds budget), point 'y' represents maximum good A purchase, and point 'x' represents maximum good B purchase.
Answer for screen readers
Point 'r' is below the budget line (underutilization), point 's' is on the budget line (efficient use), point 't' is above the budget line (exceeds budget), point 'y' represents maximum good A purchase, and point 'x' represents maximum good B purchase.
More Information
The budget constraint graph illustrates the trade-off between two goods, showing the maximum possible consumption combinations with a fixed budget.
Tips
Common mistakes include misidentifying points relative to the budget line. Ensure to understand points on, below, and above the line.
AI-generated content may contain errors. Please verify critical information