મ્હિનાની આવૃત્તિ વિતરણ વિશે ધ્યાન આપો: એક આપેલી આવૃત્તિના તાળો મુજબ વિશ્લેષણ દોરો. મ્હિનાની આવૃત્તિ વિતરણ વિશે ધ્યાન આપો: એક આપેલી આવૃત્તિના તાળો મુજબ વિશ્લેષણ દોરો.

Understand the Problem
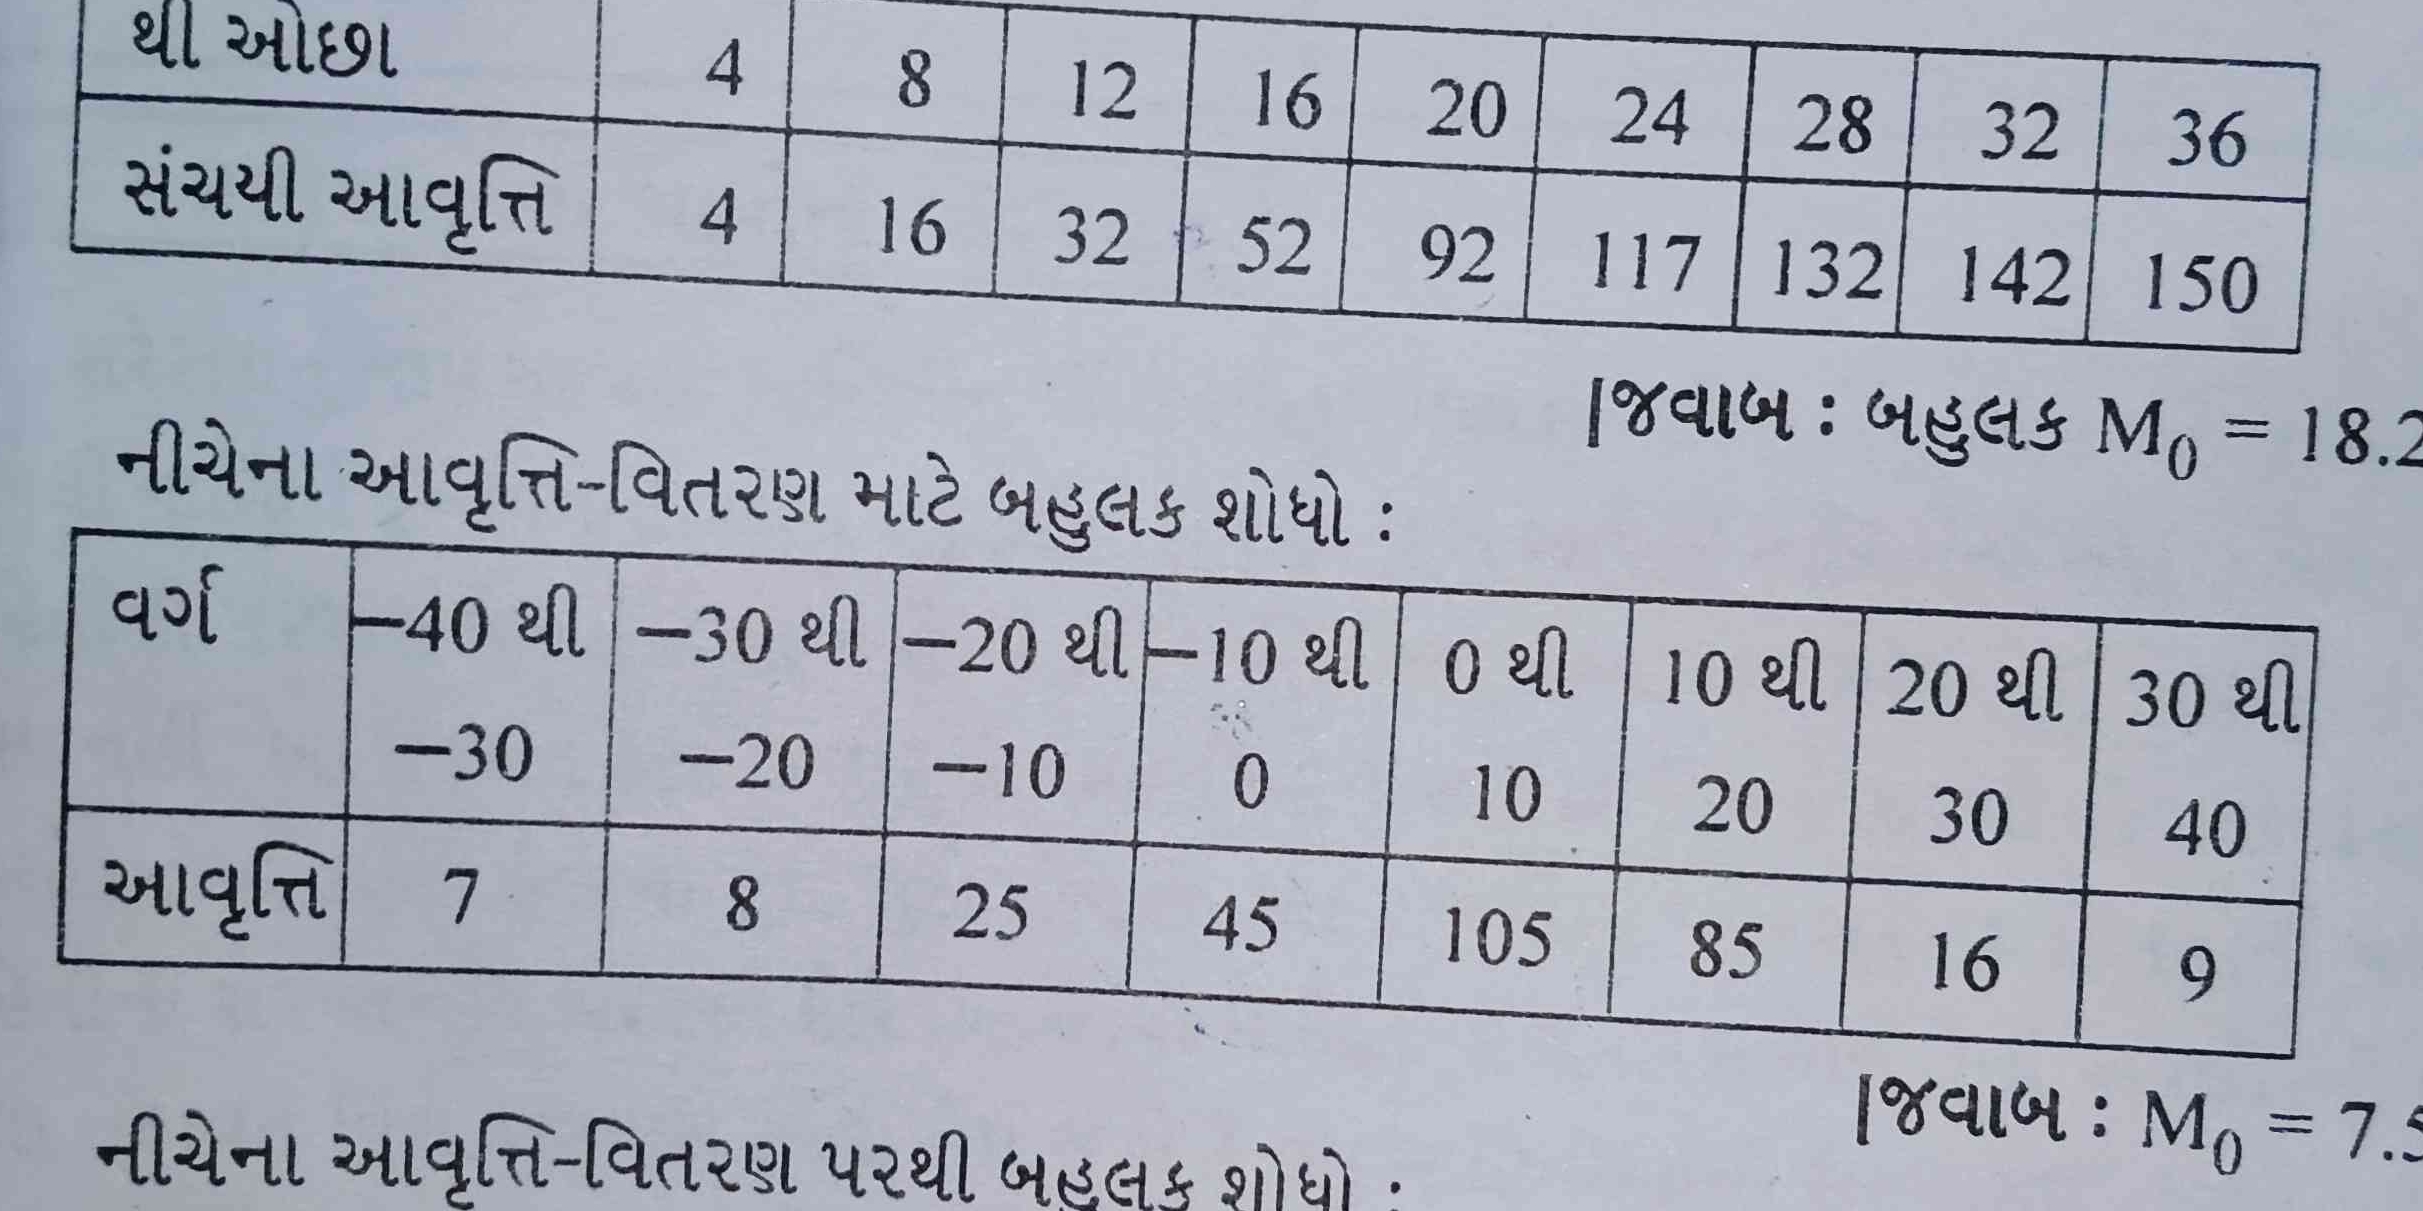
The question appears to be related to a statistical or mathematical analysis involving frequency distribution or cumulative data. It is presenting various classes with their corresponding frequencies and asking to analyze or interpret the data based on the tables provided.
Answer
First table mean \( M_0 = 18.2 \); second table mean \( M_0 = 7.5 \).
Answer for screen readers
For the first table, the mean value ( M_0 ) is calculated as: $$ M_0 = 18.2 $$
For the second table, the mean value ( M_0 ) is calculated as: $$ M_0 = 7.5 $$
Steps to Solve
-
Understand the Data Presented The table presents different classes or intervals with corresponding frequencies. These frequencies represent the count of observations in each class.
-
Identify the Class Intervals From the provided table, identify the class intervals and their corresponding frequency values. For instance, the first table presents classes like $(-40 , \text{to} , -30)$, $(-30 , \text{to} , -20)$, and so on.
-
Calculate the Cumulative Frequency Cumulative frequency is calculated by summing the frequency up to each class.
For example:
- First Class: Frequency = 7, Cumulative Frequency = 7
- Second Class: Frequency = 8, Cumulative Frequency = 7 + 8 = 15
- Continue this for all classes.
-
Calculate the Mean (M₀) of the First Table The mean can be calculated using the formula: $$ M_0 = \frac{\Sigma (f \times x)}{\Sigma f} $$ Where:
-
( f ) = frequency of each class
-
( x ) = midpoint of each class
For each class, find the midpoint ($x$) and multiply by its frequency ($f$), then sum these values and divide by the total number of observations.
- Calculate the Mean (M₀) of the Second Table Repeat the same mean calculation for the second table using the respective midpoints and frequencies.
For the first table, the mean value ( M_0 ) is calculated as: $$ M_0 = 18.2 $$
For the second table, the mean value ( M_0 ) is calculated as: $$ M_0 = 7.5 $$
More Information
The mean values obtained indicate the average of the data in their respective distributions. The means provide insight into the central tendency of the data presented in both frequency tables.
Tips
- Incorrect Midpoint Calculation: Ensure that midpoints are calculated correctly by averaging the upper and lower class limits.
- Cumulative Frequency Errors: Be careful when summing frequencies; errors can easily propagate.
- Dividing Incorrectly: When calculating the mean, ensure the denominator is the total frequency, not a miscalculated value.
AI-generated content may contain errors. Please verify critical information