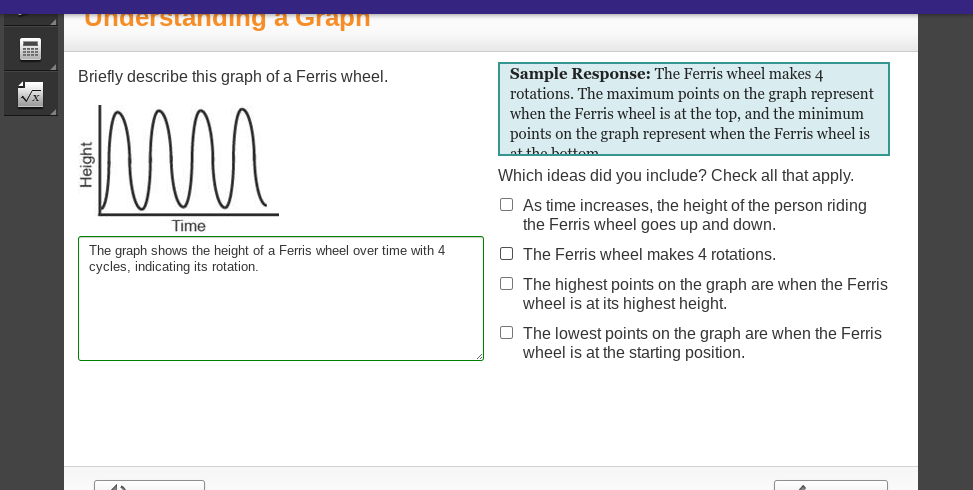
Briefly describe this graph of a Ferris wheel.

Understand the Problem
The question is asking to describe the graph of a Ferris wheel, focusing on its height over time and its rotation cycles.
Answer
The graph shows the height of a Ferris wheel over time with 4 cycles, indicating its rotation.
The graph represents the height of a Ferris wheel over time, showing 4 cycles. The graph's periodic nature indicates the wheel's rotations, with heights rising and falling as it spins.
Answer for screen readers
The graph represents the height of a Ferris wheel over time, showing 4 cycles. The graph's periodic nature indicates the wheel's rotations, with heights rising and falling as it spins.
More Information
Cycles in the graph match the periodic motion typical of circular rides like Ferris wheels, which have a regular pattern of rising and falling.
Tips
A common mistake is misinterpreting the graph as a straight line when it clearly shows cyclical behavior.
Sources
- CK-12: Describe Graph of a Ferris Wheel - ck12.org
- Class Ace: Describe Graph of a Ferris Wheel - classace.io