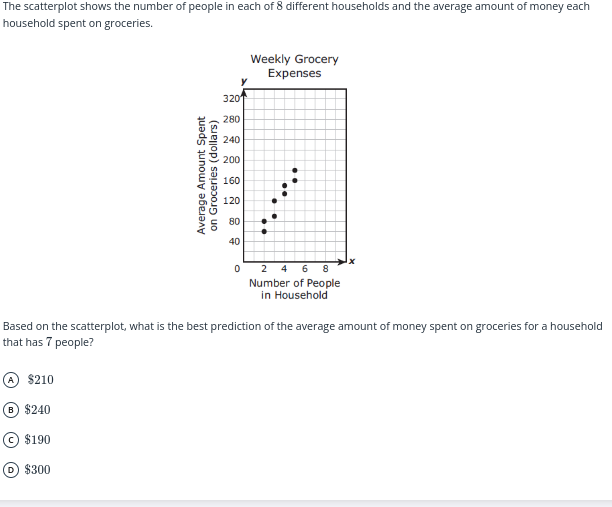
Based on the scatterplot, what is the best prediction of the average amount of money spent on groceries for a household that has 7 people?

Understand the Problem
The question is asking for a predictive value based on the scatterplot data which correlates the number of people in a household with their average grocery expenses. From the given scatterplot, one must estimate the average grocery expenditure for a household of 7 people.
Answer
$240$
Answer for screen readers
The predicted average amount of money spent on groceries for a household that has 7 people is $240.
Steps to Solve
- Identify Data Points from the Scatterplot
Look at the scatterplot to locate the data point that corresponds to a household with 7 people. Since there's no exact data point for 7, you need to look for the nearest points, which are typically at 6 and 8.
- Estimate the Grocery Expenses for 7 People
Check the average weekly grocery expenses for the household with 6 people and the household with 8 people. Based on the scatterplot:
- For 6 people: approximate value is around $210.
- For 8 people: approximate value is around $260.
- Interpolate to Estimate for 7 People
You can predict the grocery expenditure for 7 people by averaging the values found for 6 and 8 people:
$$ \text{Estimated Expense} = \frac{(\text{Value at 6}) + (\text{Value at 8})}{2} $$
So,
$$ \text{Estimated Expense} = \frac{210 + 260}{2} = 235 $$
Given options, choose the closest value, which in this case is $240.
The predicted average amount of money spent on groceries for a household that has 7 people is $240.
More Information
The method used here is called linear interpolation, which estimates a value based on two known data points. It is particularly useful when you need to estimate values from datasets or scatterplots where exact matches are not available.
Tips
- Mistaking the point closest to the desired number without considering the values on either side.
- Failing to interpolate and just guessing the value instead of calculating it.
To avoid these, always look for two data points surrounding your target value and take their average.
AI-generated content may contain errors. Please verify critical information