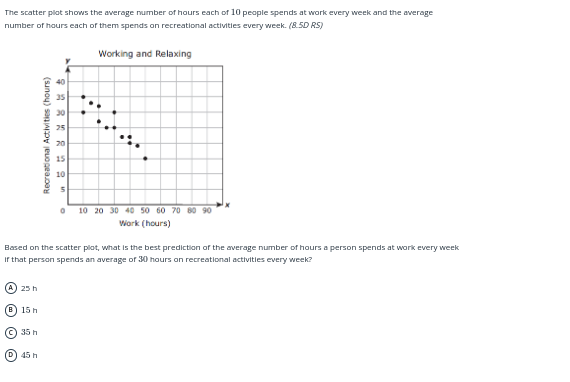
Based on the scatter plot, what is the best prediction of the average number of hours a person spends at work every week if that person spends an average of 30 hours on recreationa... Based on the scatter plot, what is the best prediction of the average number of hours a person spends at work every week if that person spends an average of 30 hours on recreational activities every week?

Understand the Problem
The question is asking for the best prediction of the average number of hours a person spends at work each week based on a scatter plot. It specifically asks for the prediction when the person spends an average of 30 hours on recreational activities each week.
Answer
The predicted average number of hours spent at work is approximately $35 \text{ h}$.
Answer for screen readers
The best prediction of the average number of hours a person spends at work each week, if they spend an average of 30 hours on recreational activities, is approximately 35 hours.
Steps to Solve
- Interpret the scatter plot
Analyze the scatter plot to determine the relationship between working hours and recreational activities. The plot shows a negative correlation; as the number of work hours increases, recreational activity hours tend to decrease.
- Identify the 30-hour recreational activity point
Locate the point on the recreational activity axis where recreational hours are 30. According to the trend in the scatter plot, trace horizontally to find the corresponding work hours.
- Estimate corresponding work hours
From the previous step, observe the point of intersection with the trend line or scatter plot data points. Estimate the average work hours for the 30-hour recreational activities.
- Determine the most suitable answer choice
Based on the estimated work hours at the recreational activity level of 30 hours, compare with the provided answer choices (25 h, 15 h, 35 h, 45 h). Choose the option that is closest to your estimation.
The best prediction of the average number of hours a person spends at work each week, if they spend an average of 30 hours on recreational activities, is approximately 35 hours.
More Information
This prediction utilizes a pattern observed in the scatter plot where there's a negative correlation between work hours and recreational activity hours. As individuals dedicate more time to recreation, they typically spend less time working.
Tips
- Not accurately reading the scatter plot: Ensure to carefully compare points rather than making assumptions.
- Overestimating or underestimating the point of intersection: Take the time to visually estimate correctly rather than rushing the analysis.
AI-generated content may contain errors. Please verify critical information