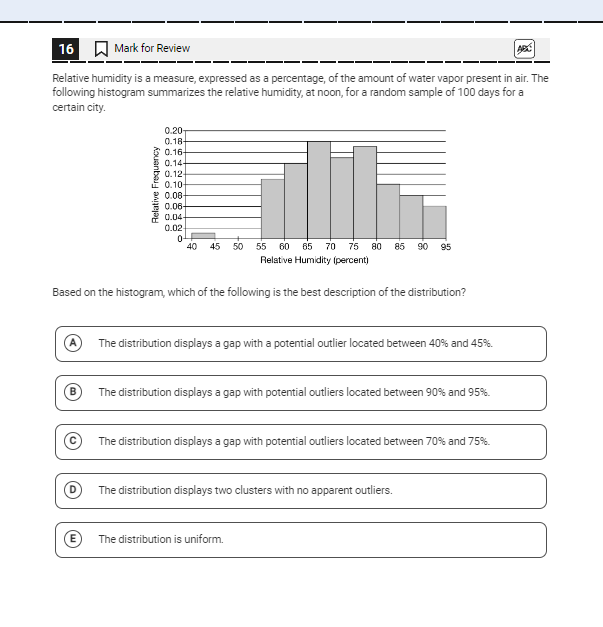
Based on the histogram, which of the following is the best description of the distribution?

Understand the Problem
The question asks for the best description of the distribution of relative humidity based on the provided histogram, which summarizes relative humidity data for 100 days. The goal is to analyze the histogram to determine characteristics like gaps or clusters in the data.
Answer
The distribution displays a gap with potential outliers located between 90% and 95%.
The best description of the distribution is: The distribution displays a gap with potential outliers located between 90% and 95%.
Answer for screen readers
The best description of the distribution is: The distribution displays a gap with potential outliers located between 90% and 95%.
More Information
The histogram shows lower relative frequency at the upper end, indicating potential outliers between 90% and 95%.
Tips
Be sure to note any lower frequencies and isolated bars, which indicate potential gaps and outliers.
AI-generated content may contain errors. Please verify critical information