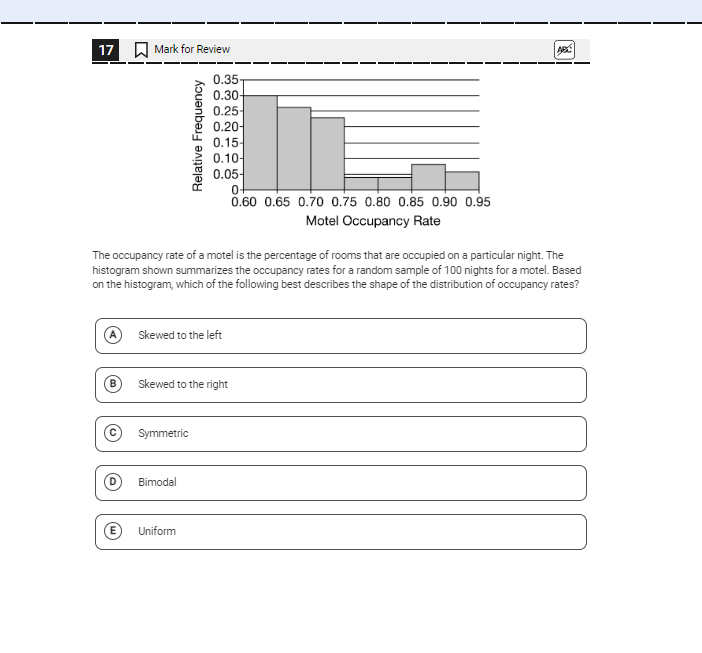
Based on the histogram, which of the following best describes the shape of the distribution of occupancy rates?

Understand the Problem
The question is asking to interpret a histogram that displays the occupancy rates of a motel. The goal is to identify the shape of the distribution based on the visual data presented in the histogram.
Answer
The distribution of occupancy rates is skewed to the right.
Answer for screen readers
The distribution of occupancy rates is Skewed to the right.
Steps to Solve
-
Analyze the histogram shape
Examine the histogram to assess how the bars are distributed across the occupancy rate ranges. Look for patterns in the frequency of occupancy rates. -
Identify the skewness
Determine if the frequency of occupancy rates is higher on one side than the other. If the taller bars are on the left side and the shorter bars are towards the right, it suggests a left skew. If the opposite is true, it indicates a right skew. -
Check for symmetry
Assess whether the histogram appears balanced, with bars of roughly the same height on both sides of the central point. If they are equal on both sides, it may be symmetric. -
Check for modes
Look for the number of peaks (modes) in the histogram. If there are two distinct peaks, it's bimodal. If there's one peak, it's unimodal. Uniform distributions appear flat without any peaks. -
Compare with options
Match your analysis of skewness, symmetry, and modes of the histogram with the answer choices provided: Skewed to the left, Skewed to the right, Symmetric, Bimodal, Uniform.
The distribution of occupancy rates is Skewed to the right.
More Information
In a right-skewed distribution, most of the data lies to the left, while a few higher values extend out to the right. This typically indicates that while many occupancy rates are lower, there are some higher occupancy rates that pull the mean to the right.
Tips
- Confusing the direction of skewness: Ensure that you carefully observe where the most frequent data points lie.
- Misidentifying the number of peaks: Ensure you count peaks accurately when determining if a distribution is bimodal or unimodal.
AI-generated content may contain errors. Please verify critical information