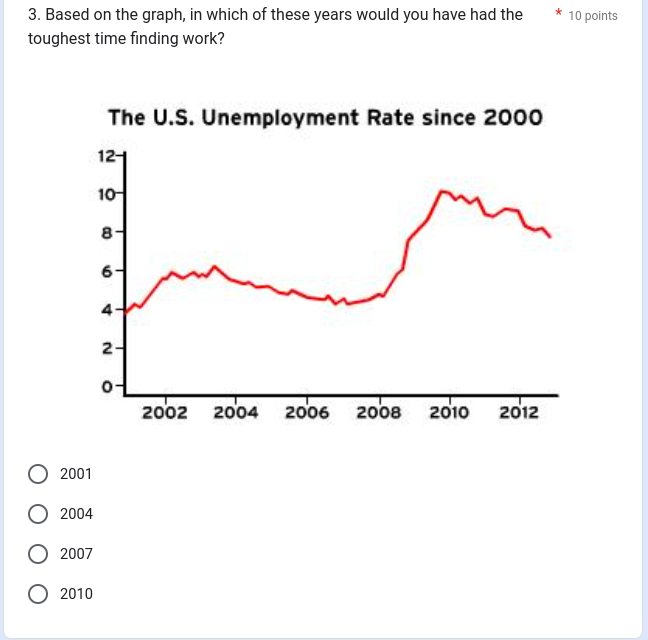
Based on the graph, in which of these years would you have had the toughest time finding work?

Understand the Problem
The question is asking to analyze the provided graph of the U.S. unemployment rate to determine in which year the unemployment was highest, indicating the toughest time to find work.
Answer
2010
The toughest time finding work would have been in 2010.
Answer for screen readers
The toughest time finding work would have been in 2010.
More Information
The graph shows that the unemployment rate peaked around 2010, which indicates a tough job market during that period.
Tips
Be sure to identify the highest point on the graph, as it represents the highest unemployment rate.
Sources
- Gr 9 Recession - Quizizz - quizizz.com
- This graph shows changes in GDP and the unemployment rate in ... - apps.ils-obregon.edu.mx
AI-generated content may contain errors. Please verify critical information