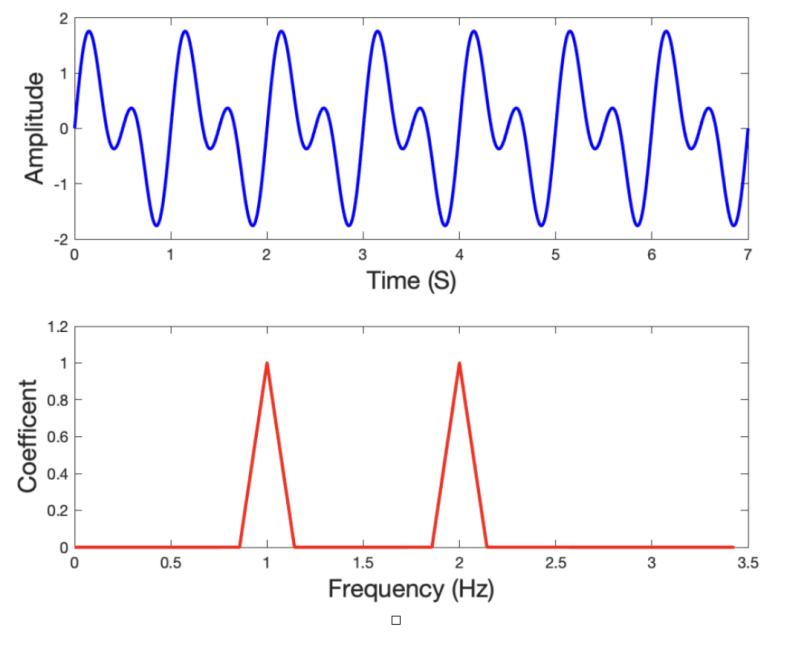
Analyze the provided plots showing amplitude versus time and coefficient versus frequency.

Understand the Problem
The question appears to involve analyzing two plots: a time-domain signal represented by amplitude versus time and a frequency-domain representation showing coefficients versus frequency. We're likely dealing with concepts of signal processing or wave analysis.
Answer
The top plot shows amplitude vs. time (time domain), while the bottom plot shows coefficients vs. frequency (frequency domain).
The top plot shows the signal's time domain representation, indicating how the signal varies over time. The bottom plot shows the signal's frequency domain representation, indicating the frequencies present in the signal.
Answer for screen readers
The top plot shows the signal's time domain representation, indicating how the signal varies over time. The bottom plot shows the signal's frequency domain representation, indicating the frequencies present in the signal.
More Information
The time domain plot (top) shows how the overall signal varies with time, capturing characteristics such as transitions and oscillations. The frequency domain plot (bottom) decomposes this signal into its constituent sinusoidal frequencies, indicating the signal's spectral composition and highlighting dominant frequencies.
Tips
A common mistake is to misinterpret the peaks in the frequency domain plot. The height of the peaks represents the signal's power at each frequency, not the time duration of these frequencies.
Sources
- Time and Frequency Domain Representation of Signals - LearnEMC - learnemc.com
- Frequency Domain and Fourier Transforms - princeton.edu
- Convert Voltage vs. Time data to frequency domain - MathWorks - mathworks.com
AI-generated content may contain errors. Please verify critical information