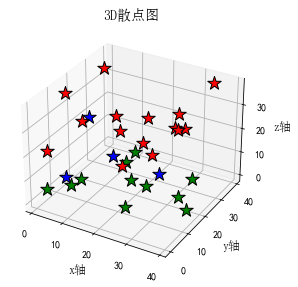
这是什么类型的图?

Understand the Problem
这个问题询问的是3D散点图的可视化,涉及如何表示数据点在三维空间中的分布。
Answer
3D scatter plot
This is a 3D scatter plot.
Answer for screen readers
This is a 3D scatter plot.
More Information
A 3D scatter plot visually represents data points in three-dimensional space, helping to identify relationships between three variables at once.
Tips
Ensure axes are clearly labeled to avoid confusion when interpreting the plot.
AI-generated content may contain errors. Please verify critical information