1. This type of graph commonly appears on a phone bill. a. How much is the most recent phone bill? b. How does this compare with the same time last year? c. What is the lowest amou... 1. This type of graph commonly appears on a phone bill. a. How much is the most recent phone bill? b. How does this compare with the same time last year? c. What is the lowest amount paid for 1 month? d. Why would the telephone company include this graph on a phone bill?
Understand the Problem
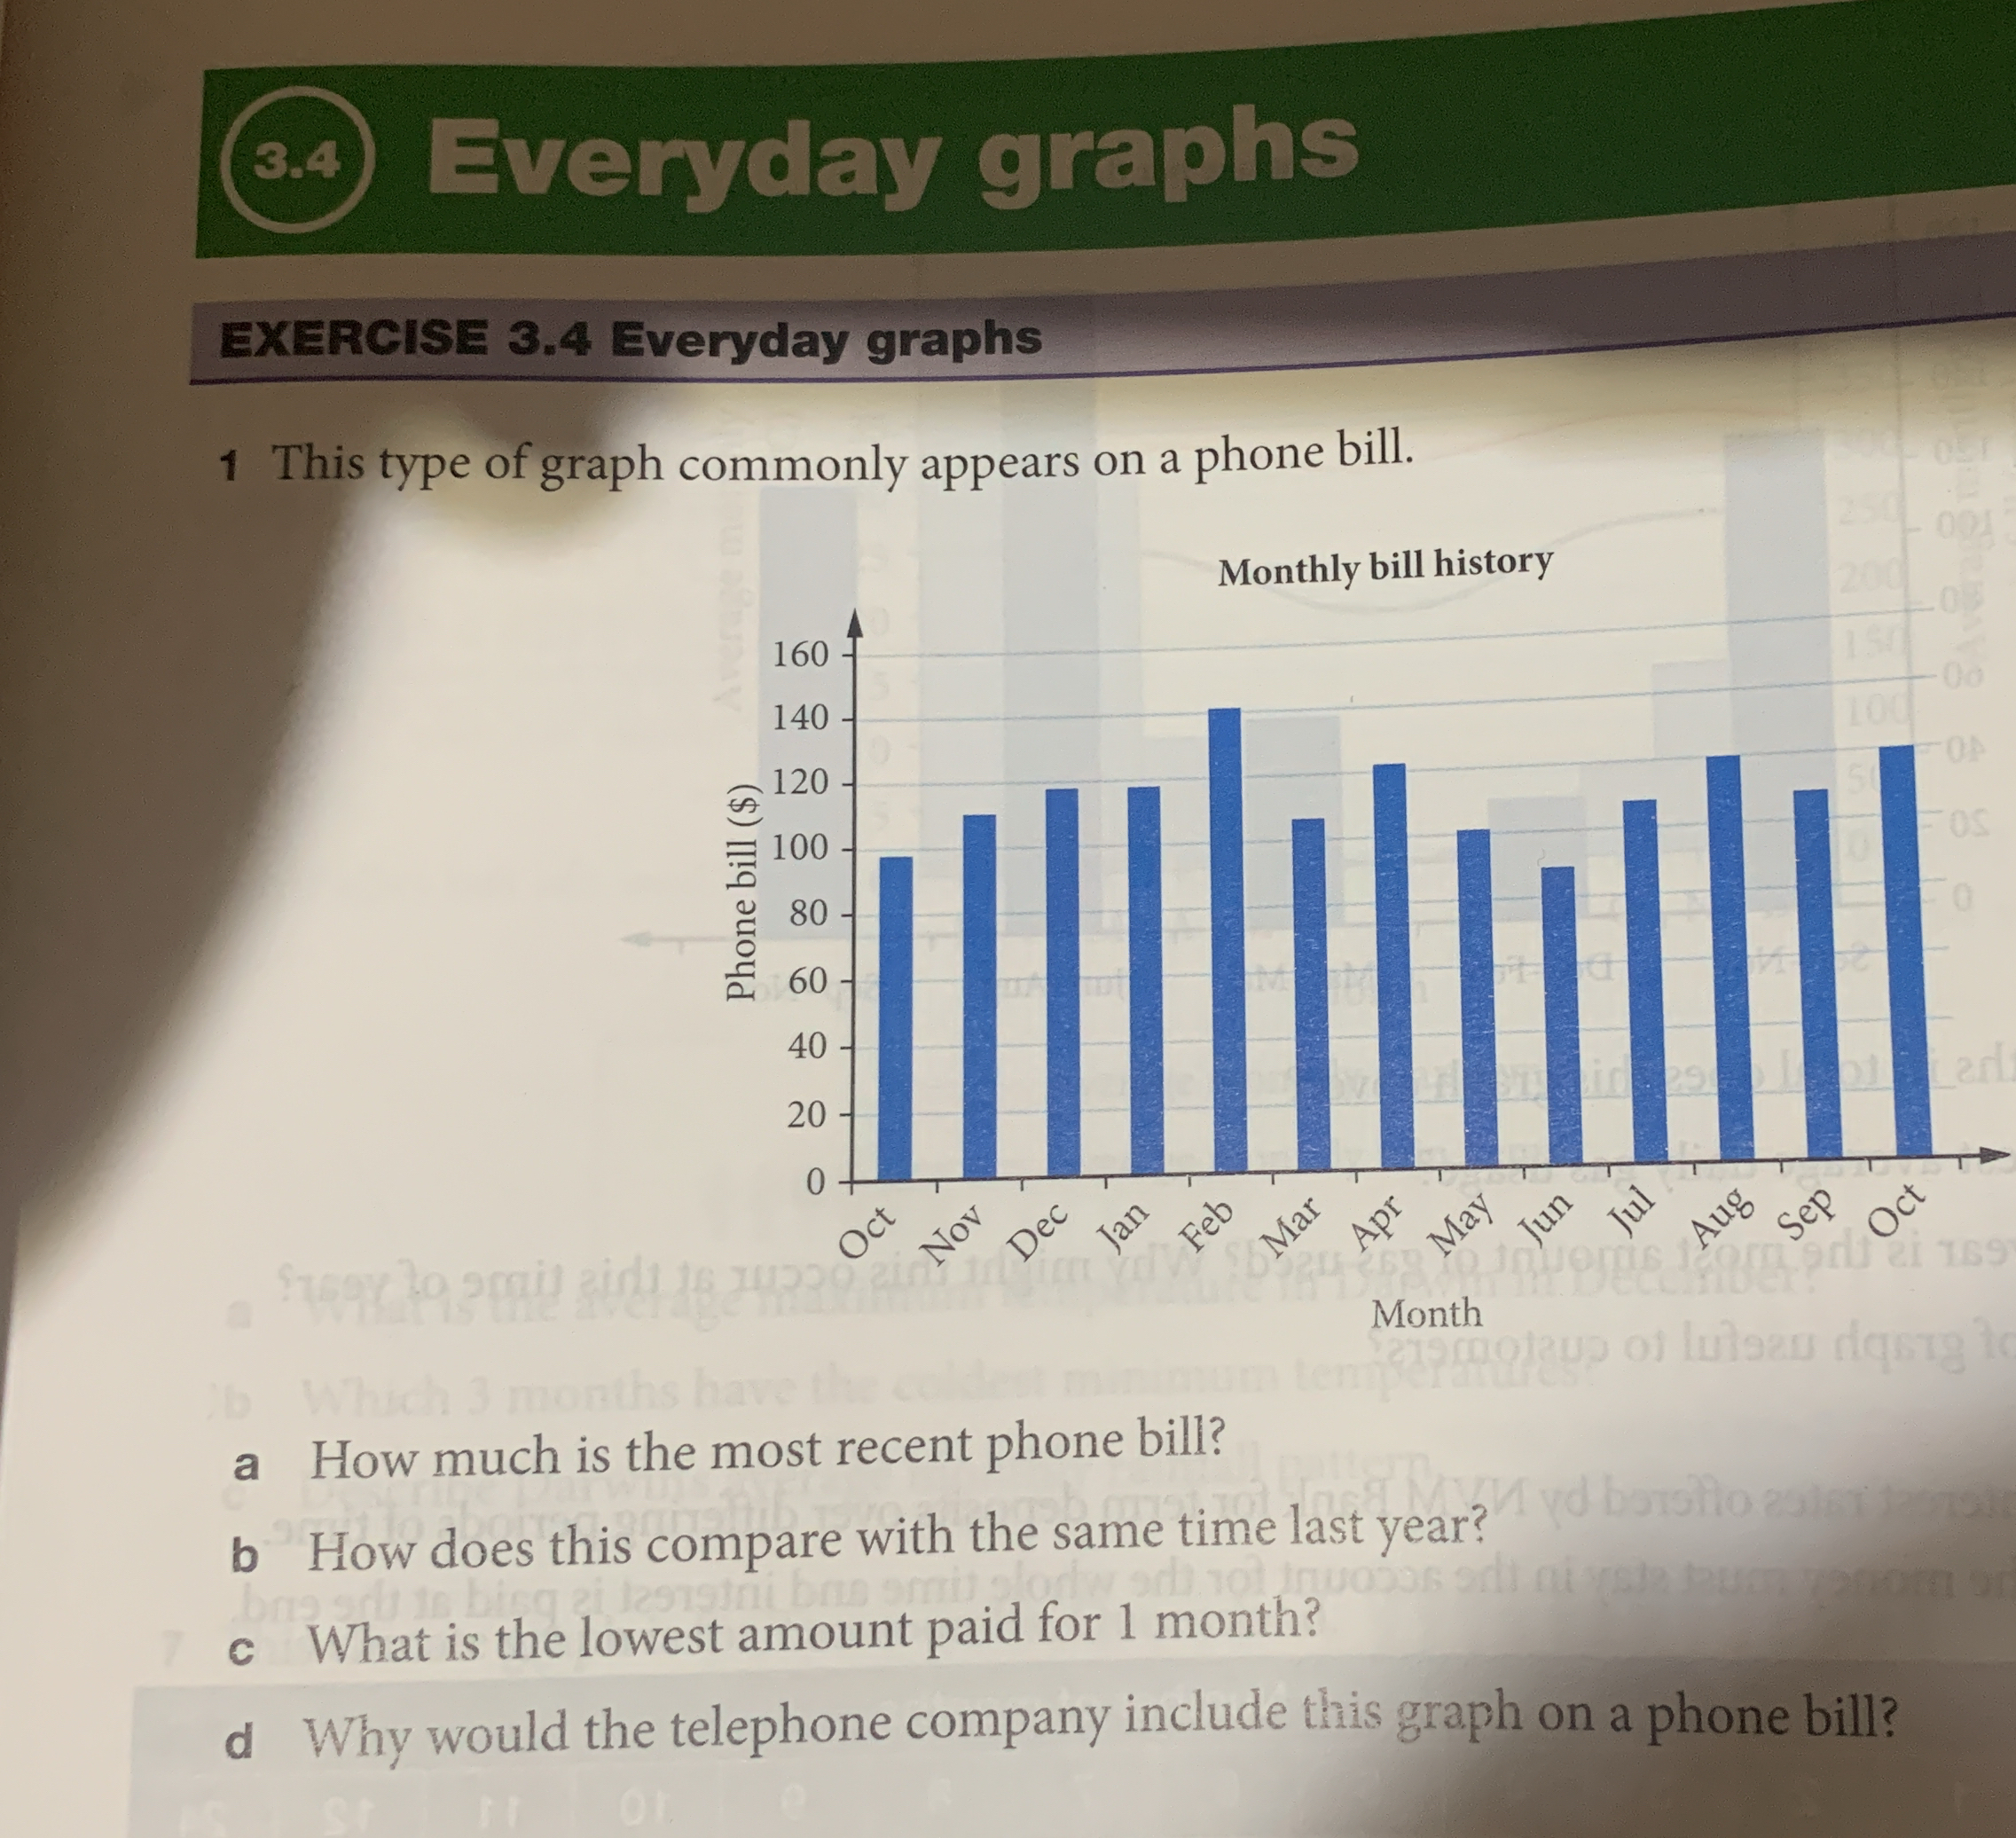
The prompt presents a bar graph displaying monthly bill history and asks several questions about it. We must analyze the graph to answer these questions. The primary goal is to extract data from the graph to provide accurate answers.
Answer
a. $100 $ b. Similar c. $80 $ d. To provide a customer with billing context
Answer for screen readers
a. The most recent phone bill is approximately $100. b. The most recent bill is similar to the bill from the same time last year. c. The lowest amount paid for one month is approximately $80. d. The telephone company includes this graph to provide customers context of their billing history.
Steps to Solve
- Determine the value of the most recent bill
The most recent bill corresponds to the rightmost bar in the graph, labeled "Oct". The height of the bar aligns approximately with the $100 mark on the y-axis.
- Compare the most recent bill to the same time last year
The most recent bill is October, and "the same time last year" also corresponds to the October data labeled on the left side of the graph. The value of the October bill from last year is near $100 which is similar to the value of October of this year.
- Find the lowest amount paid for one month
Scan the graph to identify the shortest bar, which represents the lowest bill payment. The shortest bar is for June, and its height is nearly $80.
- Identify the telephone company's motive of including this graph on a phone bill
The telephone company might include the graph to provide customers context of their billing history. The phone company would want customers to know the variability of the services being billed.
a. The most recent phone bill is approximately $100. b. The most recent bill is similar to the bill from the same time last year. c. The lowest amount paid for one month is approximately $80. d. The telephone company includes this graph to provide customers context of their billing history.
More Information
Bar graphs are commonly used to visualize and compare data across different categories, in this case monthly bills.
Tips
- Misreading the values on the y-axis.
- Incorrectly identifying the shortest bar.
AI-generated content may contain errors. Please verify critical information