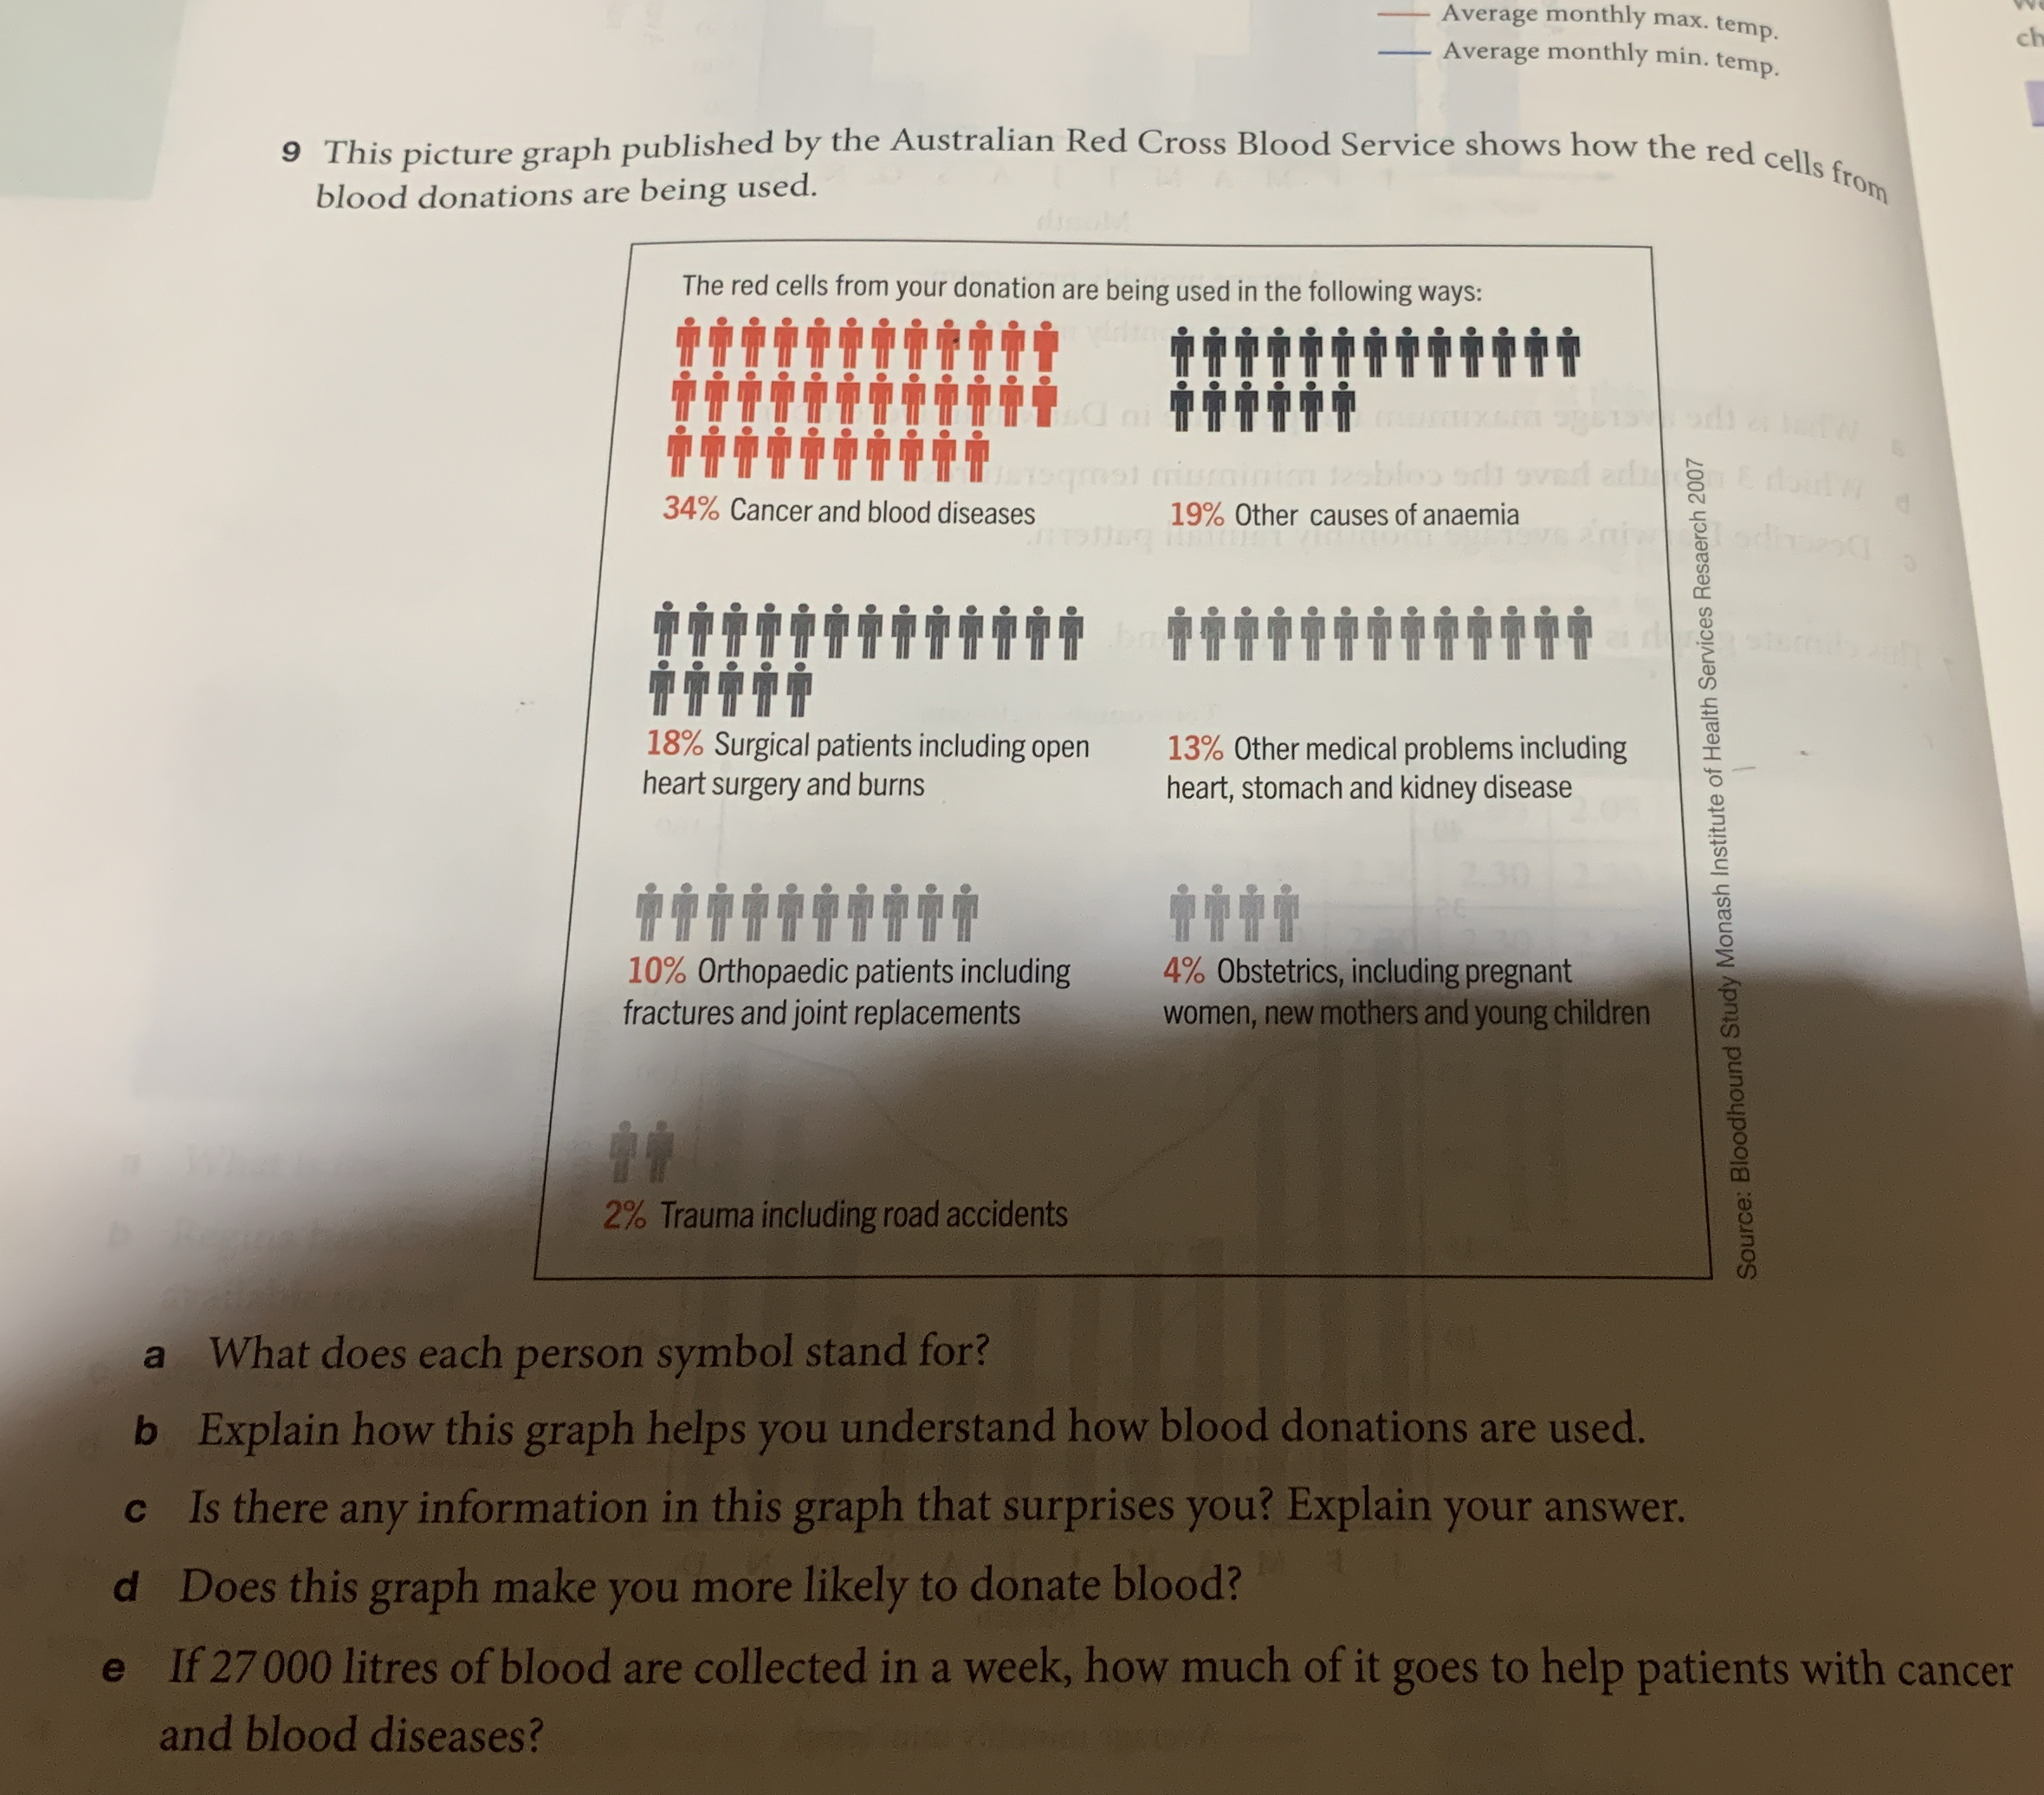
This picture graph published by the Australian Red Cross Blood Service shows how the red cells from blood donations are being used. a. What does each person symbol stand for? b. Ex... This picture graph published by the Australian Red Cross Blood Service shows how the red cells from blood donations are being used. a. What does each person symbol stand for? b. Explain how this graph helps you understand how blood donations are used. c. Is there any information in this graph that surprises you? Explain your answer. d. Does this graph make you more likely to donate blood? e. If 27 000 litres of blood are collected in a week, how much of it goes to help patients with cancer and blood diseases?
Understand the Problem
The image presents a series of questions based on a picture graph illustrating how red blood cells from blood donations are utilized. The questions range from interpreting what each symbol in the graph represents, to explaining how the graph provides insight into blood donation usage, identifying surprising information within the graph, assessing whether the graph encourages blood donation, and calculating the amount of blood used for cancer and blood disease patients given a total weekly collection.
Answer
a. A percentage of red blood cell usage. b. Distribution of red blood cell usage. c. Answer will vary. d. Answer will vary. e. 9,180 litres.
a. Each person symbol likely represents a percentage of how red blood cells from donations are used, but the exact number isn't specified. b. The graph shows the distribution of red blood cell usage across different medical needs. c. Answer will vary on personal experiences. d. Answer will vary, based on personal opinions. e. 9,180 litres of blood goes to help patients with cancer and blood diseases.
Answer for screen readers
a. Each person symbol likely represents a percentage of how red blood cells from donations are used, but the exact number isn't specified. b. The graph shows the distribution of red blood cell usage across different medical needs. c. Answer will vary on personal experiences. d. Answer will vary, based on personal opinions. e. 9,180 litres of blood goes to help patients with cancer and blood diseases.
More Information
The answer for part 'e' was determined as follows: 27,000 litres * 34% (0.34) = 9,180 litres.
Tips
Pay close attention to the details and labels provided within the graph to accurately interpret the data.
Sources
- Red Blood Cell Donation - Power Reds | Red Cross Blood Services - redcrossblood.org
- Lifeblood | Be a life-saver today | Donate blood and more - lifeblood.com.au
AI-generated content may contain errors. Please verify critical information