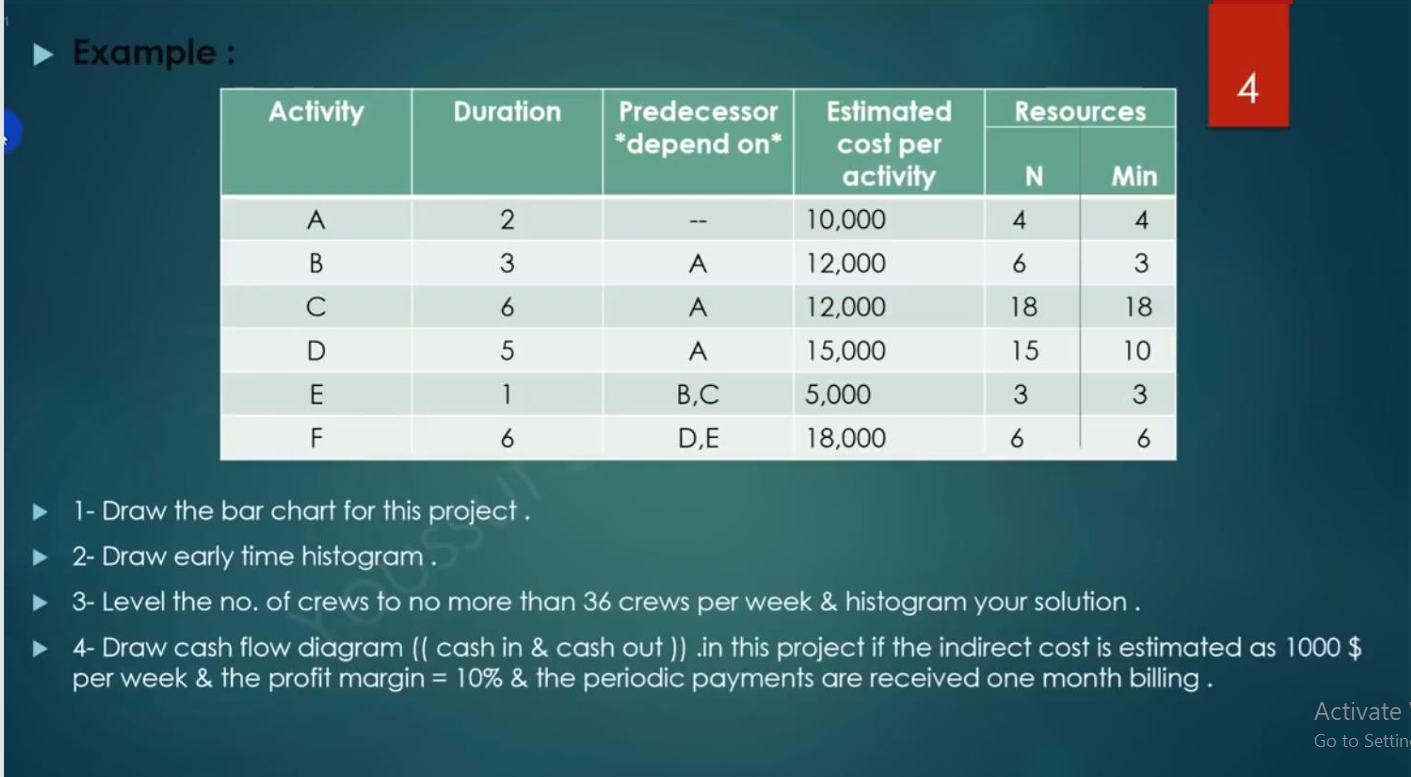
1- Draw the bar chart for this project. 2- Draw early time histogram. 3- Level the number of crews to no more than 36 crews per week & histogram your solution. 4- Draw cash flow di... 1- Draw the bar chart for this project. 2- Draw early time histogram. 3- Level the number of crews to no more than 36 crews per week & histogram your solution. 4- Draw cash flow diagram (cash in & cash out). In this project if the indirect cost is estimated as $1000 and the periodic payments are received one month billing.

Understand the Problem
The question is requesting help with a project management task involving creating a bar chart, drawing a time histogram, leveling crew numbers, and designing a cash flow diagram for a project with specific parameters. This involves both graphical representation and some calculations related to costs and crew management.
Answer
Bar chart and histogram drawn, crews leveled to not exceed 36 per week, cash flow diagram calculated based on costs and earnings.
Answer for screen readers
To derive the results:
- Bar Chart: Created based on activity durations.
- Early Time Histogram: Calculate start and finish weeks for each activity.
- Total leveled crews: Adjusted as needed without exceeding 36 per week.
- Cash Flow Diagram: Compare costs and earnings, incorporating indirect costs and profit margin.
Steps to Solve
-
Create a Bar Chart for the Project
To draw the bar chart, list each activity along the x-axis and their durations on the y-axis. For example:
- Activity A: 2 weeks
- Activity B: 3 weeks
- Activity C: 6 weeks
- Activity D: 5 weeks
- Activity E: 1 week
- Activity F: 6 weeks
Plot bars that correspond to these durations.
-
Draw the Early Time Histogram
To create the early time histogram, calculate the earliest start and finish times for each activity:
- Start Activity A at week 0 (Duration: 2 weeks), Finish: week 2.
- Activity B can start after A finishes (Week 2), Duration: 3 weeks, Finish: week 5.
- Activity C starts after A, Duration: 6 weeks, Finish: week 8.
- Activity D starts after A, Duration: 5 weeks, Finish: week 7.
- Activity E can start after both B and C finish (Week 5). Duration: 1 week, Finish: week 6.
- Activity F can start after D and E complete. Start: week 8, Duration: 6 weeks, Finish: week 14.
-
Level the Number of Crews
Total crew members per week based on resource requirements:
- A: 4 crew members
- B: 6 crew members
- C: 18 crew members
- D: 15 crew members
- E: 3 crew members
- F: 6 crew members
Calculate total crew necessary each week and adjust to not exceed 36. You might need to delay or reschedule tasks to balance crew workload.
-
Draw the Cash Flow Diagram
Cash flow involves calculating costs:
- Total cost per activity = Cost per activity × Duration
- Indirect costs = $1000
- Cash in/out diagram should represent inflow (earnings minus costs) over each week, considering a profit margin of 10% and payments received one month after billing.
- Example: For week 1–2, calculate total costs and expected earnings, then summarize these for the cash flow.
To derive the results:
- Bar Chart: Created based on activity durations.
- Early Time Histogram: Calculate start and finish weeks for each activity.
- Total leveled crews: Adjusted as needed without exceeding 36 per week.
- Cash Flow Diagram: Compare costs and earnings, incorporating indirect costs and profit margin.
More Information
This exercise showcases project management basics, including task scheduling, resource leveling, and financial planning. Understanding these concepts is crucial for efficient project execution.
Tips
- Ignoring dependencies: Activities must follow their predecessors.
- Underestimating resource needs: Always check if crew numbers exceed limits.
- Not factoring indirect costs into cash flow calculations.
AI-generated content may contain errors. Please verify critical information