Podcast
Questions and Answers
What is the concept of a linear relationship between paired quantitative data?
What is the concept of a linear relationship between paired quantitative data?
A linear relationship between paired quantitative data exists when the data points on a scatterplot tend to form a straight line.
What is the role of a scatter plot when analyzing paired data?
What is the role of a scatter plot when analyzing paired data?
A scatter plot helps to assess whether a linear relationship exists and determines its direction, indicating a positive, negative, or no correlation.
What are the two coefficients commonly used to analyze linear correlation?
What are the two coefficients commonly used to analyze linear correlation?
- Spearman coefficient and Fisher coefficient
- Karl-Pearson coefficient and Spearman coefficient (correct)
- Karl-Pearson coefficient and Kendall coefficient
- Fisher coefficient and Kendall coefficient
What is the coefficient of determination?
What is the coefficient of determination?
What is the essence of paired data?
What is the essence of paired data?
Describe the core principle of correlation.
Describe the core principle of correlation.
Define a scatterplot in terms of data representation.
Define a scatterplot in terms of data representation.
What does the linear correlation coefficient 'r' measure?
What does the linear correlation coefficient 'r' measure?
What are the two assumptions associated with the linear correlation coefficient 'r'?
What are the two assumptions associated with the linear correlation coefficient 'r'?
Explain the three main advantages of using rank correlation.
Explain the three main advantages of using rank correlation.
What is the primary disadvantage of using Rank Correlation, and how does it affect its application?
What is the primary disadvantage of using Rank Correlation, and how does it affect its application?
What is the central concept of rank correlation?
What is the central concept of rank correlation?
What is the purpose of the rank correlation test?
What is the purpose of the rank correlation test?
What are the null and alternative hypotheses in rank correlation?
What are the null and alternative hypotheses in rank correlation?
What is the significance of 'rs' in rank correlation?
What is the significance of 'rs' in rank correlation?
What is the difference between 'rs' and 'ρs' in rank correlation?
What is the difference between 'rs' and 'ρs' in rank correlation?
What is the importance of the p-value in rank correlation?
What is the importance of the p-value in rank correlation?
What is the most common error made when interpreting correlation?
What is the most common error made when interpreting correlation?
Explain how averages affect correlation analysis, and what consequences can arise from misinterpreting this effect.
Explain how averages affect correlation analysis, and what consequences can arise from misinterpreting this effect.
What is the key point to remember about linearity in relation to correlation?
What is the key point to remember about linearity in relation to correlation?
Flashcards
Correlation
Correlation
A relationship between two variables where a change in one variable is associated with a change in the other.
Scatterplot
Scatterplot
A visual representation of paired data points, plotted on a graph with x and y axes.
Positive Linear Relationship
Positive Linear Relationship
A scatterplot where the points form a pattern that slopes upwards from left to right.
Negative Linear Relationship
Negative Linear Relationship
Signup and view all the flashcards
No Correlation
No Correlation
Signup and view all the flashcards
Linear Correlation Coefficient (r)
Linear Correlation Coefficient (r)
Signup and view all the flashcards
Perfect Correlation
Perfect Correlation
Signup and view all the flashcards
Coefficient of Determination (r^2)
Coefficient of Determination (r^2)
Signup and view all the flashcards
Hypothesis Testing for Linear Correlation
Hypothesis Testing for Linear Correlation
Signup and view all the flashcards
Rank Correlation (Spearman's Rho)
Rank Correlation (Spearman's Rho)
Signup and view all the flashcards
Assumptions for Linear Correlation
Assumptions for Linear Correlation
Signup and view all the flashcards
Sum of x-values (x)
Sum of x-values (x)
Signup and view all the flashcards
Sum of y-values (y)
Sum of y-values (y)
Signup and view all the flashcards
Sum of squared x-values (x^2)
Sum of squared x-values (x^2)
Signup and view all the flashcards
Sum of squared y-values (y^2)
Sum of squared y-values (y^2)
Signup and view all the flashcards
Sum of xy products (xy)
Sum of xy products (xy)
Signup and view all the flashcards
Number of paired data points (n)
Number of paired data points (n)
Signup and view all the flashcards
Weak Correlation (r)
Weak Correlation (r)
Signup and view all the flashcards
Strong Correlation (r)
Strong Correlation (r)
Signup and view all the flashcards
No Correlation (r = 0)
No Correlation (r = 0)
Signup and view all the flashcards
Correlation Analysis
Correlation Analysis
Signup and view all the flashcards
Pearson Linear Correlation
Pearson Linear Correlation
Signup and view all the flashcards
Spearman Rank Correlation
Spearman Rank Correlation
Signup and view all the flashcards
Scatter
Scatter
Signup and view all the flashcards
Chi-Square Test
Chi-Square Test
Signup and view all the flashcards
Autocorrelation
Autocorrelation
Signup and view all the flashcards
Regression Analysis
Regression Analysis
Signup and view all the flashcards
Cluster Plot
Cluster Plot
Signup and view all the flashcards
Time Series Plot
Time Series Plot
Signup and view all the flashcards
Regression
Regression
Signup and view all the flashcards
Linear Regression
Linear Regression
Signup and view all the flashcards
Non-linear Regression
Non-linear Regression
Signup and view all the flashcards
Polynomial Regression
Polynomial Regression
Signup and view all the flashcards
Logistic Regression
Logistic Regression
Signup and view all the flashcards
Multiple Regression
Multiple Regression
Signup and view all the flashcards
Model Evaluation
Model Evaluation
Signup and view all the flashcards
Mean Squared Error (MSE)
Mean Squared Error (MSE)
Signup and view all the flashcards
R-squared (R^2)
R-squared (R^2)
Signup and view all the flashcards
P-value
P-value
Signup and view all the flashcards
Study Notes
Correlation and Rank Correlation
- Correlation exists when one variable relates to another.
- A scatter plot visualizes paired (x,y) data. Each point represents a pair.
- The x-axis is horizontal.
- The y-axis is vertical.
Lecture Objectives
- Students will understand linear relationships in paired quantitative data.
- Students will analyze scatter plots to identify linear relationships.
- Students will conduct hypothesis tests to calculate and evaluate correlation coefficients (Pearson and Spearman) using JMP software.
- Students will compute and interpret the coefficient of determination.
- Refer to chapters 10 & 13, sections 10.1 and 13.6.
Paired Data Overview
- Assess if a relationship exists.
- Evaluate the strength of the relationship.
Correlation Definition
- Correlation exists between two variables when one is related to the other in some way.
Scatterplot Definition
- A scatterplot is a graph that shows paired (x, y) sample data plotted on a horizontal x-axis and a vertical y-axis.
Scatter Diagram of Paired Data
- The example shows data about manatee deaths versus registered boats.
- The data is plotted in an x-y plane, representing the relationship between these two variables.
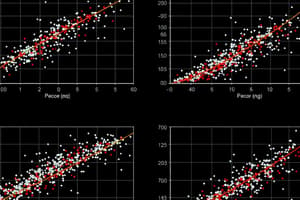
Scatter Plots Illustrating Different Correlation Structures
- Illustrates examples of perfect positive correlation, perfect negative correlation, strong negative correlation, quadratic function, random values, and no correlation. Visually demonstrating different patterns.
JMP Example: Scatterplot
- Examines blood sugar levels (Y) in relation to Body Mass Index (BMI) in the diabetes.jmp file.
- Asks if there's a linear relationship between these variables.
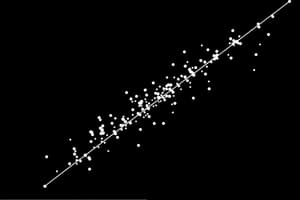
JMP Fit Y by X: Scatterplot
- Shows a positive linear relationship between blood sugar levels and BMI.
- The scatter plot displays many data points.
JMP Example: Scatterplot (Blood Pressure)
- Data from fourteen students measures blood pressure in patients.
- Examines correlation between systolic and diastolic blood pressures.
Linear Correlation Coefficient Definition
- The coefficient (r) measures the strength of a linear relationship between paired x and y values in a sample.
Strength of Linear Relationship
- Correlation coefficients quantify the strength of linear relationships.
- Values above 0.8 are considered very strong, 0.6-0.8 moderately strong, 0.3-0.5 fair, and less than 0.3 poor.
Linear Correlation Coefficient Assumptions
- The sample data (x, y) must be a random sample.
- The (x, y) pairs should follow a bivariate normal distribution.
Linear Correlation Coefficient Notations
- n denotes the number of data pairs.
- Σ denotes summation of items.
- Σx represents the sum of all x-values.
- Σx² denotes the sum of squared x-values.
- (Σx)² means the sum of x-values squared.
- Σxy denotes the sum of the products of corresponding x and y values.
- r is the sample correlation coefficient.
- ρ is the population correlation coefficient.
Example: Calculating r
- Example data set (x,y) values to calculate the correlation coefficient (r).
Calculating r
- Shows the formula and calculation steps for calculating the correlation coefficient.
Linear Correlation Coefficient Properties
- The correlation coefficient (r) always falls between -1 and +1.
- The value of r doesn't change if the variable values are scaled differently.
- The choice of x or y doesn't affect the correlation value.
- r measures the strength of the linear relationship between two variables.
Explained Variation Coefficient of Determination Interpreting
- r² represents the proportion of the variation in y explained by the linear relationship with x.
- r² is the coefficient of determination.
Example for r²: Boats and Manatees
- Using data from table 9-1, the linear correlation coefficient r is 0.922.
- r² is 0.850, meaning 85% of the variation in manatee deaths can be attributed to the variation in boat registrations.
Linear Correlation Coefficient Formal Hypothesis Testing
- Null Hypothesis (H₀): ρ = 0 (no significant linear correlation)
- Alternative Hypothesis (H₁): ρ ≠ 0 (significant linear correlation)
JMP Example: Pearson Linear Correlation
- Analyze the relationship between variables Y and BMI using the diabetes.jmp dataset in JMP.
JMP Output: Pearson Correlation
- Calculates the Pearson correlation coefficient (r) and the p-value. Example coefficient and p-values are provided.
Interpretation: Pearson Linear Correlation
- Defines the strength, direction, and significance of the linear correlation between Y and BMI.
Rank Correlation Definition
- Rank correlation uses the ranks of sample data, not the actual values.
- This version assesses associations between variables, whether linear or non-linear.
Rank Correlation Advantages
- Can be used in more diverse situations than parametric methods.
- Can analyze paired data expressed as ranks or convertible to ranks.
- Can detect non-linear relationships.
- Computational simplicity compared to parametric correlation.
Rank Correlation Disadvantages
- Lower efficiency (0.91) than parametric methods.
Rank Correlation Notations
- rs is the sample rank correlation coefficient.
- ρs is the population rank correlation coefficient.
- n is the number of data pairs.
JMP Example: Spearman's Rank Correlation
- Examines cotinine in the body as an indicator of smoking behavior.
- Assesses correlation between cigarettes per day and cotinine levels.
JMP Output: Spearman's Rank Correlation
- Provides the Spearman correlation coefficient (rs) and associated p-value.
Interpretation: Spearman's Rank Correlation
- Summarizes the strength, direction, and significance of the Spearman's rank correlation.
Common Errors Involving Correlation
- Causation: Correlation does not imply causality.
- Averages: Averages can mask individual variation and potentially inflate correlation coefficients.
- Non-linearity: A relationship might exist between x and y, but it may not be linear, even without a significant linear correlation.
Studying That Suits You
Use AI to generate personalized quizzes and flashcards to suit your learning preferences.
Related Documents
Description
This quiz focuses on understanding correlation and rank correlation in paired quantitative data. Students will analyze scatter plots and conduct hypothesis tests to evaluate correlation coefficients using JMP software. Key concepts from chapters 10 and 13 are covered, including the coefficient of determination.