Podcast
Questions and Answers
Explain how a scatter plot can be used to visually assess the strength and direction of a linear relationship between two variables.
Explain how a scatter plot can be used to visually assess the strength and direction of a linear relationship between two variables.
A scatter plot displays data points for two variables, where the pattern indicates the relationship's strength and direction. Tightly clustered points suggest a strong relationship, while scattered points indicate a weak one. An upward trend shows a positive relationship, and a downward trend shows a negative relationship.
Describe a scenario where two variables might appear to have a strong positive correlation but are not causally related. What is this phenomenon called?
Describe a scenario where two variables might appear to have a strong positive correlation but are not causally related. What is this phenomenon called?
A city's ice cream sales and crime rates might both rise during the summer. This does not mean that ice cream causes crime, or vice versa, but rather that a third variable (e.g., hot weather) influences both. This is known as a spurious correlation.
Explain why correlation does not equal causation.
Explain why correlation does not equal causation.
Correlation indicates the extent to which two variables are related or tend to vary together, but it doesn't prove that one variable causes changes in the other. There could be confounding variables influencing both, or the direction of causality could be reversed or non-existent.
How might outliers influence the interpretation of correlational data, and what steps can be taken to mitigate their impact?
How might outliers influence the interpretation of correlational data, and what steps can be taken to mitigate their impact?
What does a Pearson's r value of 0 indicate about the relationship between two variables?
What does a Pearson's r value of 0 indicate about the relationship between two variables?
Explain the difference between a positive and a negative correlation, providing an example of each.
Explain the difference between a positive and a negative correlation, providing an example of each.
Describe a research scenario where investigating the relationship between two variables using correlational methods would be more appropriate than conducting an experimental study. Explain why.
Describe a research scenario where investigating the relationship between two variables using correlational methods would be more appropriate than conducting an experimental study. Explain why.
Explain the concept of 'restriction of range' and how it can affect the calculated correlation between two variables.
Explain the concept of 'restriction of range' and how it can affect the calculated correlation between two variables.
Explain how the reliability of measurement can impact observed correlations. What happens to the observed correlation as reliability decreases?
Explain how the reliability of measurement can impact observed correlations. What happens to the observed correlation as reliability decreases?
Explain how the range of Pearson's r allows for standardized comparison of relationships between different pairs of variables.
Explain how the range of Pearson's r allows for standardized comparison of relationships between different pairs of variables.
Describe a scenario where a strong negative correlation might not indicate a causal relationship.
Describe a scenario where a strong negative correlation might not indicate a causal relationship.
How does the spread of data points around the line of best fit on a scatter plot influence Pearson's correlation coefficient?
How does the spread of data points around the line of best fit on a scatter plot influence Pearson's correlation coefficient?
Explain what a Pearson's r close to zero implies about the relationship between two variables and what it does not imply.
Explain what a Pearson's r close to zero implies about the relationship between two variables and what it does not imply.
In the context of social sciences, why are perfect correlations (+1.00 or -1.00) rarely observed?
In the context of social sciences, why are perfect correlations (+1.00 or -1.00) rarely observed?
If variable A consistently increases as variable B decreases, describe the expected value of Pearson’s r and explain why.
If variable A consistently increases as variable B decreases, describe the expected value of Pearson’s r and explain why.
Explain the difference between correlation and causation, and why it is important to avoid inferring causation from correlation.
Explain the difference between correlation and causation, and why it is important to avoid inferring causation from correlation.
Describe a scenario where you might expect a positive correlation between two variables in a social science context.
Describe a scenario where you might expect a positive correlation between two variables in a social science context.
Describe the implications of a correlation coefficient of +1.00. Can this be seen in social science?
Describe the implications of a correlation coefficient of +1.00. Can this be seen in social science?
Describe why correlation is an invaluable tool for researchers.
Describe why correlation is an invaluable tool for researchers.
Explain how a 'ceiling effect' can lead to an underestimation of the true correlation between two variables.
Explain how a 'ceiling effect' can lead to an underestimation of the true correlation between two variables.
Describe a scenario where two variables might exhibit a strong correlation, but changes in one variable do not cause changes in the other. What is this phenomenon called?
Describe a scenario where two variables might exhibit a strong correlation, but changes in one variable do not cause changes in the other. What is this phenomenon called?
Explain why the Pearson correlation coefficient might not be an appropriate measure of association when examining the relationship between anxiety levels and performance on a complex task.
Explain why the Pearson correlation coefficient might not be an appropriate measure of association when examining the relationship between anxiety levels and performance on a complex task.
In a study examining the relationship between hours of sleep and exam performance, researchers suspect that student stress levels might influence both variables. How could partial correlation be used to address this concern?
In a study examining the relationship between hours of sleep and exam performance, researchers suspect that student stress levels might influence both variables. How could partial correlation be used to address this concern?
Explain what the difference is between the 'sign' and the 'number' in a correlation coefficient.
Explain what the difference is between the 'sign' and the 'number' in a correlation coefficient.
A study finds a correlation of r = -0.75 between exercise frequency and body mass index (BMI) in adults. Interpret this correlation in terms of the strength and direction of the association, and discuss one potential limitation in drawing causal inferences from this result.
A study finds a correlation of r = -0.75 between exercise frequency and body mass index (BMI) in adults. Interpret this correlation in terms of the strength and direction of the association, and discuss one potential limitation in drawing causal inferences from this result.
Flashcards
Correlation Coefficient (r)
Correlation Coefficient (r)
A measure of the strength and direction of a linear relationship between two variables, ranging from -1 to +1.
Weak Correlation
Weak Correlation
r between 0 and ±0.29 indicates a weak or no linear relationship between variables.
Moderate Correlation
Moderate Correlation
r between ±0.3 and ±0.59 suggests a moderate linear relationship between variables.
Strong Correlation
Strong Correlation
Signup and view all the flashcards
Spurious Correlation
Spurious Correlation
Signup and view all the flashcards
Ceiling/Floor Effect
Ceiling/Floor Effect
Signup and view all the flashcards
Correlation
Correlation
Signup and view all the flashcards
Linear Relationship
Linear Relationship
Signup and view all the flashcards
Positive Linear Relationship
Positive Linear Relationship
Signup and view all the flashcards
Negative Linear Relationship
Negative Linear Relationship
Signup and view all the flashcards
Scatter Plot
Scatter Plot
Signup and view all the flashcards
Purpose of Scatter Plots
Purpose of Scatter Plots
Signup and view all the flashcards
Scatter Plot Data Points
Scatter Plot Data Points
Signup and view all the flashcards
Scatter Plot Construction
Scatter Plot Construction
Signup and view all the flashcards
No Relationship
No Relationship
Signup and view all the flashcards
Pearson's r
Pearson's r
Signup and view all the flashcards
Positive Correlation
Positive Correlation
Signup and view all the flashcards
Negative Correlation
Negative Correlation
Signup and view all the flashcards
Zero Correlation
Zero Correlation
Signup and view all the flashcards
Perfect Positive Correlation
Perfect Positive Correlation
Signup and view all the flashcards
Zero Correlation
Zero Correlation
Signup and view all the flashcards
Correlation Strength
Correlation Strength
Signup and view all the flashcards
Correlation Range
Correlation Range
Signup and view all the flashcards
Study Notes
- Statistical methods can analyze differences between samples
- Research questions explore the degree to which two scores are related
- Linear relationships are central to correlation analysis and can be represented by a straight line
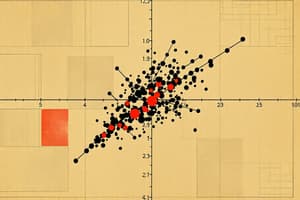
Positive Linear Relationship
- Indicates values on two variables move in the same direction
- As scores on one variable increase, scores on the other variable also increase, and vice versa
Negative Linear Relationship
- Shows values on two variables move in opposite directions
- As scores on one variable increase, scores on the other variable decrease, and vice versa
Zero Correlation
- Data points are widely scattered without a specific trend
- It's not possible to draw a line of best fit
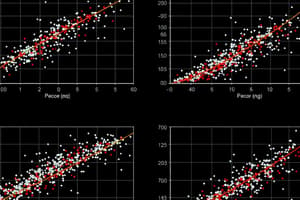
Scatter Plots
- A scatter plot examines the relationship between two variables
- It visually represents how individual scores are scattered over a range
- Each point on the plot represents an individual's scores on two variables
- Scatter plots help in visualizing the relationship between variables
- A graph is constructed with one variable on the X axis (horizontal) and the other on the Y axis (vertical)
- Scores from each subject are plotted on the graph
- Each subject's score on one variable provides the X co-ordinate, and the score on the second variable provides the Y co-ordinate
Quantifying Relationships
- A scatter plot helps identify a positive or negative relationship
- Mathematical methods measure the relationship between variables, using correlation
- Correlation statistics can be used to compare relationships between variables
Correlation
- Pearson's r is the main statistic to measure the correlation of two variables
- The correlation coefficient (r) provides a standard measure of how correlated two variables are
- Correlation coefficients range between -1 and +1
- The (+ or -) sign indicates the relationship's direction
- When r > 0 (+), the relationship is positive
- When r < 0 (-), the relationship is negative, signifying an inverse relationship
- When r = 0, there is no relationship between the two variables
- Correlation coefficient value closer to -1.00 or +1.00 indicates a stronger relationship
- A perfect positive correlation (+1.00) means higher scores on one variable relate to higher scores on the other for every subject
- Perfect relationships aren't usually found in social sciences
- A correlation of 0 rarely occurs
- Wider spread of scores around the line indicates a lower correlation coefficient
Correlation Strength
- Weak correlation: r between 0 and ± 0.29
- Moderate correlation: r between ± 0.3 and ± 0.59
- Strong correlation: r between ± 0.6 and ± 1.00
- Correlation coefficient value comprises two components:
- Sign (+/-) indicates direction
- Number indicates strength
- For example -0.4 is a stronger correlation than +0.3
Correlation and Causation
- Correlation coefficients determine whether values on one variable are associated with values on a second variable
- Correlation and causation are often confused
- Spurious correlation describes a chance correlation between two variables without one causing the other
Examples of Spurious Correlation
- High school graduates vs. donut consumption
- Global average temperature vs. number of pirates
- Per capita cheese consumption correlates with the number of people who died by becoming tangled in their bedsheets with r = 0.95
- Number of people who drowned by falling into a pool correlates with number of Films Nicolas Cage appeared in with r = 0.67
- The Relationship Between Stork Populations and Human Birth in rates of r = 0.62
Non-Linear Relationships
- The Pearson correlation coefficient measures linear associations
- Not all relations between variables are linear
Ceiling and Floor Effects
- Occur when a large percentage of participants score at the higher end (ceiling) or lower end (floor) of a variable
- Ceiling and floor effects skew correlation coefficient values
- For example on an easy exam, many students may achieve full marks regardless of study time (a ceiling effect)
Partial Correlation
- Aims to address the third variable problem
- Looks at relationship between two variables while controlling for the effect of a third variable statistically
- For example, research might look at the association between viewing violent TV and violent behavior, while controlling for exposure to violence in the home
Studying That Suits You
Use AI to generate personalized quizzes and flashcards to suit your learning preferences.