Podcast
Questions and Answers
What conclusion can be drawn regarding the relationship between ice cream sales and drowning incidents?
What conclusion can be drawn regarding the relationship between ice cream sales and drowning incidents?
- Drowning incidents cause ice cream sales
- Both are caused by a third factor (e.g., hot weather) (correct)
- There is no relationship
- Ice cream sales cause drowning incidents
What does the presence of two distinct clusters of points in a scatter plot suggest?
What does the presence of two distinct clusters of points in a scatter plot suggest?
- A single linear relationship exists
- There are two separate groups in the data (correct)
- The data has no correlation
- The data is biased
When using the equation $y=5x+2$ to predict $y$ for $x=100$, what is the major risk of this extrapolation?
When using the equation $y=5x+2$ to predict $y$ for $x=100$, what is the major risk of this extrapolation?
- It may overestimate the actual value
- It assumes a perfect correlation
- It involves extrapolating beyond the data range
- All of the above (correct)
If two scatter plots have the same correlation coefficient but different spreads, what does this imply?
If two scatter plots have the same correlation coefficient but different spreads, what does this imply?
If a scatter plot shows that $y$ increases rapidly at first and then levels off, what type of relationship might this indicate?
If a scatter plot shows that $y$ increases rapidly at first and then levels off, what type of relationship might this indicate?
What does a scatter plot with a downward trend in hours studied versus exam scores indicate?
What does a scatter plot with a downward trend in hours studied versus exam scores indicate?
What is the correlation coefficient when points in a scatter plot form a perfect diagonal line sloping upwards?
What is the correlation coefficient when points in a scatter plot form a perfect diagonal line sloping upwards?
How does an outlier far from the trend line affect the correlation coefficient?
How does an outlier far from the trend line affect the correlation coefficient?
Which pattern in a scatter plot indicates no correlation between variables?
Which pattern in a scatter plot indicates no correlation between variables?
What relationship is suggested by points following a curve that opens upwards in a scatter plot?
What relationship is suggested by points following a curve that opens upwards in a scatter plot?
If the trend line in a scatter plot is defined as $y = 3x + 4$ and $x = 5$, what is the value of $y$?
If the trend line in a scatter plot is defined as $y = 3x + 4$ and $x = 5$, what is the value of $y$?
What does a slope of 0.5 in the trend line $y = 0.5x - 3$ indicate about the relationship between $x$ and $y$?
What does a slope of 0.5 in the trend line $y = 0.5x - 3$ indicate about the relationship between $x$ and $y$?
What does a large residual in a scatter plot suggest?
What does a large residual in a scatter plot suggest?
Flashcards
Ice cream sales and drowning
Ice cream sales and drowning
Ice cream sales and drowning incidents are correlated because both are influenced by a third factor, such as hot weather.
Scatter plot clusters
Scatter plot clusters
Distinct clusters in a scatter plot suggest the presence of separate groups or categories within the data.
Extrapolation risk
Extrapolation risk
Extrapolating beyond the observed data range on a scatter plot risks overestimating or underestimating the value, as the relationship outside the data may not follow the trend.
Same correlation, different spread
Same correlation, different spread
Signup and view all the flashcards
Nonlinear data pattern
Nonlinear data pattern
Signup and view all the flashcards
Negative Correlation
Negative Correlation
Signup and view all the flashcards
Perfect Positive Correlation
Perfect Positive Correlation
Signup and view all the flashcards
Outlier Effect on Correlation
Outlier Effect on Correlation
Signup and view all the flashcards
No Correlation
No Correlation
Signup and view all the flashcards
Quadratic Relationship
Quadratic Relationship
Signup and view all the flashcards
Line of Best Fit Equation
Line of Best Fit Equation
Signup and view all the flashcards
Residual Meaning
Residual Meaning
Signup and view all the flashcards
Weakest Correlation
Weakest Correlation
Signup and view all the flashcards
Study Notes
Scatter Plots and Correlation
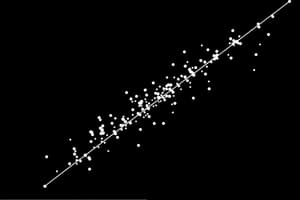
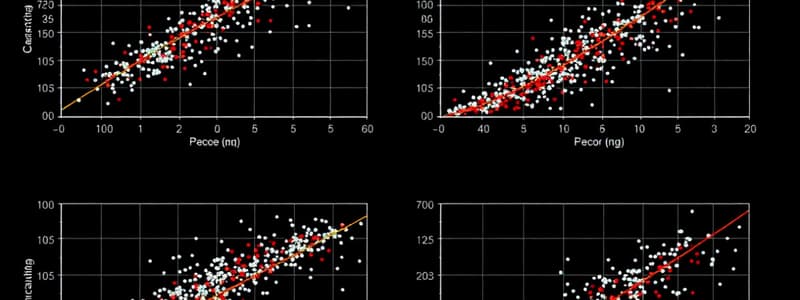
- Correlation: A scatter plot displays the relationship between two variables. A downward trend indicates a negative correlation, an upward trend a positive correlation, and random points no correlation.
- Correlation Coefficient: A perfect diagonal line sloping upwards corresponds to a correlation coefficient of 1.
- Outliers: Outliers, points far from the trend line, decrease the correlation coefficient.
- No Correlation: Points scattered randomly on a scatter plot indicate no correlation.
- Nonlinear Relationships: A curve (not a straight line) suggests a non-linear relationship, such as quadratic or logarithmic. A U-shaped curve suggests a quadratic relationship.
Lines of Best Fit and Predictions
- Line of Best Fit Equation: A line of best fit can be expressed as an equation, such as 𝑦 = 3𝑥 + 4.
- Prediction: To find the predicted value of 𝑦 given a value of 𝑥, substitute the 𝑥-value into the equation for the line of best fit.
- Slope Interpretation: The slope of a trend line, such as 0.5 in 𝑦 = 0.5𝑥 − 3, indicates how much 𝑦 changes for every unit change in 𝑥.
- Interpretation of Slope (Example): In the equation 𝑦 = 0.5𝑥 − 3, for every one-unit increase in 𝑥, 𝑦 increases by 0.5.
Advanced Concepts
- Residuals: A large residual indicates a point is far from the trend line.
- Correlation Strength: A correlation coefficient of -0.2 represents the weakest relationship among the listed examples, while 0.9 represents the strongest.
- Causation vs. Correlation: A strong correlation between variables does not imply causality. A third factor usually influences both variables.
- Data Clusters: Multiple data clusters in a scatter plot suggest separate groups within the dataset.
- Extrapolation Risks: Using a trend line to predict values outside the range of the data (extrapolation) carries the risk of overestimating the actual value. It is not guaranteed.
Additional Points
- Comparing Scatter Plots: Scatter plots with the same correlation coefficient but different spreads imply similar relationships but different variances, the spread of the data.
- Nonlinear Relationships (Example): A rapid initial increase in 𝑦 followed by a leveling off might reflect a logarithmic relationship.
Studying That Suits You
Use AI to generate personalized quizzes and flashcards to suit your learning preferences.