Podcast
Questions and Answers
What is the main characteristic of the human eye mentioned in the video?
What is the main characteristic of the human eye mentioned in the video?
Answer hidden
What does information visualisation aim to achieve?
What does information visualisation aim to achieve?
Answer hidden
How is data referred to in relation to creativity and innovation in the text?
How is data referred to in relation to creativity and innovation in the text?
Answer hidden
What percentage of information processed by the human eye is consciously acknowledged?
What percentage of information processed by the human eye is consciously acknowledged?
Answer hidden
Senses have different bandwidths, with sight having the fastest and taste the ______, and the text provides a comparison to computer components.
Senses have different bandwidths, with sight having the fastest and taste the ______, and the text provides a comparison to computer components.
Answer hidden
What does the text describe as a 'new soil' for creativity and innovation?
What does the text describe as a 'new soil' for creativity and innovation?
Answer hidden
America is often perceived as having the biggest military budget, but its percentage of GDP is smaller than other countries like ______.
America is often perceived as having the biggest military budget, but its percentage of GDP is smaller than other countries like ______.
Answer hidden
Design is a problem-solving process, and information design aims to make complex data accessible and ______.
Design is a problem-solving process, and information design aims to make complex data accessible and ______.
Answer hidden
Flashcards are hidden until you start studying
Study Notes
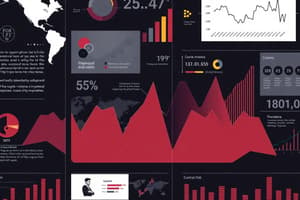
- The text discusses the problem of information overload and the potential solution of visualizing information to better understand patterns and connections.
- The author was frustrated with the meaningless reporting of billion-dollar amounts in the press and created a visual representation to understand the context.
- The image displays various amounts represented by differently colored boxes and shows relationships between numbers that would otherwise be scattered.
- OPEX revenue is represented by a large green box worth 780 billion a year, while a small pixel representing a climate change fund is three billion.
- Americans donate over $300 billion to charity each year compared to $120 billion given by top seventeen industrialized nations in foreign aid.
- The costs of wars, such as Iraq and Afghanistan, have significantly increased since their initial predictions.
- The visualization allows for addition of numbers and exploration of relationships between different data points.
- The text also discusses the concept of a "landscape of the world's fears" and the patterns that can be discovered when visualizing media reports on fears over time.
- There is a regular pattern in media reports of fear towards violent videogames, occurring every November due to the release of new games and the anniversary of significant events like the Columbine shooting.
- The data is referred to as a "new soil" for creativity and innovation due to the vast amount of information available and the potential for new insights through visualization.
- The text describes a pattern in retail sales, with a spike around Easter and before Christmas and a dip over the summer.
- The author and a colleague analyzed 10,000 Facebook updates containing the phrase "breakup" and found a pattern of clearing out before spring break, being single over the summer, and the lowest day of the year being Christmas Day.
- The text discusses the author's background as a programmer, writer, and designer, and their discovery of a dormant design literacy from being exposed to media over the years.
- The text mentions Danish physicist Nils Jørgen Cappelan Mortensen who converted the bandwidth of the senses into computer terms.
- Senses have different bandwidths, with sight having the fastest and taste the slowest, and the text provides a comparison to computer components.- The human eye processes a large amount of information, with only 7% consciously acknowledged.
- The eye is highly sensitive to patterns and variations in color, shape, and texture.
- Combining the language of the eye with language and concepts results in a new kind of communication that enhances both.
- America is often perceived as having the biggest military budget, but its percentage of GDP is smaller than other countries like China.
- The largest military budget does not always indicate military superiority or aggressive intentions.
- Data visualization is a way to compress and understand large amounts of information.
- A balloon race visualization of nutritional supplements shows the relationship between efficacy and popularity.
- Curating and creating interactive visualizations from data allows for easy access and exploration of information.
- Information visualization can be applied to ideas and concepts, helping to understand complex systems and perspectives.
- Design is a problem-solving process, and information design aims to make complex data accessible and understandable.
- Societal issues, such as information overload and skepticism, can be addressed through effective information design.
- Volcanoes, like the recent Icelandic volcano, can have carbon-neutral effects, making them an interesting and beautiful example of natural phenomena.
Studying That Suits You
Use AI to generate personalized quizzes and flashcards to suit your learning preferences.
Description
Explore the concepts of information overload, data visualization, visual patterns, and design literacy through this quiz. Learn about the potential of visualizing information to understand patterns, connections, and relationships between different data points.