Podcast
Questions and Answers
What is required before creating a chart in Excel?
What is required before creating a chart in Excel?
- Data must be stored in cells of a worksheet (correct)
- Data must be present in multiple workbooks
- A chart type must be selected
- A dashboard must be prepared
Which of the following best describes the nature of a chart in Excel?
Which of the following best describes the nature of a chart in Excel?
- Charts only display data from a single worksheet
- Charts are static and do not change after creation
- Charts cannot be modified once created
- Charts represent data series graphically based on certain chart types (correct)
How can you identify different data series in a line chart?
How can you identify different data series in a line chart?
- By the chart type selected
- By using different colors, line styles, or markers (correct)
- By their numeric values
- By the worksheet names used
What happens to a chart in Excel if the underlying data changes?
What happens to a chart in Excel if the underlying data changes?
Where can charts be located in an Excel workbook?
Where can charts be located in an Excel workbook?
What is a key feature of embedded charts in Excel?
What is a key feature of embedded charts in Excel?
In what scenario might you decide to use data from multiple worksheets for a chart?
In what scenario might you decide to use data from multiple worksheets for a chart?
Which statement about chart types in Excel is true?
Which statement about chart types in Excel is true?
Which of the following methods can be used to add new elements to a chart?
Which of the following methods can be used to add new elements to a chart?
What is the easiest method to delete a chart element?
What is the easiest method to delete a chart element?
How should embedded charts be printed from Excel?
How should embedded charts be printed from Excel?
What should be done before printing a sheet that contains embedded charts?
What should be done before printing a sheet that contains embedded charts?
What must be done to prevent a specific embedded chart from appearing on the printout?
What must be done to prevent a specific embedded chart from appearing on the printout?
What is the maximum number of data points allowed in a single data series for a 3-D chart?
What is the maximum number of data points allowed in a single data series for a 3-D chart?
Which command can be used to switch the row and column orientation of a chart?
Which command can be used to switch the row and column orientation of a chart?
What is the total maximum number of data points allowed in a chart?
What is the total maximum number of data points allowed in a chart?
If Excel does not guess the data orientation correctly when creating a chart, what is the solution?
If Excel does not guess the data orientation correctly when creating a chart, what is the solution?
When inserting a default chart quickly, which two key combinations can be used?
When inserting a default chart quickly, which two key combinations can be used?
What occurs if the columns of a chart do not have adjacent relevant data after changing the row and column orientation?
What occurs if the columns of a chart do not have adjacent relevant data after changing the row and column orientation?
How many data series can be included in a chart?
How many data series can be included in a chart?
What should be included in the data selection when creating a chart?
What should be included in the data selection when creating a chart?
What is the primary function of a chart in Excel?
What is the primary function of a chart in Excel?
Which of the following statements about charts is true?
Which of the following statements about charts is true?
What is one of the key advantages of using a chart over raw numerical data?
What is one of the key advantages of using a chart over raw numerical data?
What basic step is involved in creating a chart in Excel?
What basic step is involved in creating a chart in Excel?
What can charts in Excel help you identify in your business data?
What can charts in Excel help you identify in your business data?
Why are well-conceived charts particularly useful?
Why are well-conceived charts particularly useful?
What type of chart is mentioned as an example in the document?
What type of chart is mentioned as an example in the document?
Which of the following is NOT a primary capability of Excel regarding charts?
Which of the following is NOT a primary capability of Excel regarding charts?
What happens when you paste a chart into a different workbook?
What happens when you paste a chart into a different workbook?
Which command allows you to convert an embedded chart to a chart sheet?
Which command allows you to convert an embedded chart to a chart sheet?
What is the shortcut for copying a chart?
What is the shortcut for copying a chart?
How can you delete multiple charts at once?
How can you delete multiple charts at once?
What option should you select to change an embedded chart back to a chart sheet?
What option should you select to change an embedded chart back to a chart sheet?
Which of the following actions deletes a chart sheet?
Which of the following actions deletes a chart sheet?
If you want to copy a chart from a chart sheet to a new location, what should you do?
If you want to copy a chart from a chart sheet to a new location, what should you do?
What is the first step to move a chart to a different location within the same worksheet?
What is the first step to move a chart to a different location within the same worksheet?
A chart is only useful for comparing numeric values with one another.
A chart is only useful for comparing numeric values with one another.
Excel charts were considered crude when first introduced.
Excel charts were considered crude when first introduced.
Creating a chart in Excel requires selecting the data and pressing Ctrl+F1.
Creating a chart in Excel requires selecting the data and pressing Ctrl+F1.
Using a chart can help summarize large sets of numerical data more effectively.
Using a chart can help summarize large sets of numerical data more effectively.
Column charts are the only type of chart available in Excel.
Column charts are the only type of chart available in Excel.
Visual representations like charts can help identify business trends more quickly than analyzing numbers alone.
Visual representations like charts can help identify business trends more quickly than analyzing numbers alone.
A well-designed chart is less effective at communicating information than a spreadsheet filled with numbers.
A well-designed chart is less effective at communicating information than a spreadsheet filled with numbers.
Charting capabilities in Excel have not significantly improved since the software was first released.
Charting capabilities in Excel have not significantly improved since the software was first released.
A chart in Excel can only use data from a single worksheet.
A chart in Excel can only use data from a single worksheet.
Each point on a line chart is represented by a uniquely shaped marker.
Each point on a line chart is represented by a uniquely shaped marker.
The appearance of a chart's data series can be modified after the chart is created.
The appearance of a chart's data series can be modified after the chart is created.
Embedded charts in Excel do not float on top of the worksheet's drawing layer.
Embedded charts in Excel do not float on top of the worksheet's drawing layer.
If the underlying data for a chart changes, the chart must be manually updated to reflect the new data.
If the underlying data for a chart changes, the chart must be manually updated to reflect the new data.
A chart cannot be created without having data stored in cells within a worksheet.
A chart cannot be created without having data stored in cells within a worksheet.
Charts in Excel can only be displayed on a separate chart sheet and not embedded within worksheets.
Charts in Excel can only be displayed on a separate chart sheet and not embedded within worksheets.
Different data series in a chart can be identified by their thickness, line style, and color.
Different data series in a chart can be identified by their thickness, line style, and color.
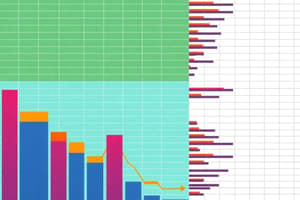
The left value axis on the chart displays scale values from 0 to 100,000.
The left value axis on the chart displays scale values from 0 to 100,000.
A chart with two value axes is unnecessary if the data series have similar scale values.
A chart with two value axes is unnecessary if the data series have similar scale values.
The Profit Margin data series can be plotted on the left axis without visibility issues.
The Profit Margin data series can be plotted on the left axis without visibility issues.
You can print embedded charts in Excel the same way as printing a worksheet.
You can print embedded charts in Excel the same way as printing a worksheet.
To delete a chart element in Excel, you can only use the Delete key.
To delete a chart element in Excel, you can only use the Delete key.
A pie chart includes axes similar to other chart types.
A pie chart includes axes similar to other chart types.
When printing a chart that is on a chart sheet, Excel always prints it on a page by itself.
When printing a chart that is on a chart sheet, Excel always prints it on a page by itself.
Gridlines in a chart help to visualize the magnitude of data points.
Gridlines in a chart help to visualize the magnitude of data points.
Charts in Excel have no limitations regarding the amount of data they can handle.
Charts in Excel have no limitations regarding the amount of data they can handle.
You must always access the Format Chart Area task pane to print an embedded chart.
You must always access the Format Chart Area task pane to print an embedded chart.
You can only move chart elements by selecting them and dragging their borders.
You can only move chart elements by selecting them and dragging their borders.
A trend line can be added to any type of chart in Excel.
A trend line can be added to any type of chart in Excel.
The axes labels of a chart do not typically include additional titles or categories.
The axes labels of a chart do not typically include additional titles or categories.
A chart can include up to 256,000 total data points.
A chart can include up to 256,000 total data points.
The maximum number of data series in a chart is 512.
The maximum number of data series in a chart is 512.
A 3-D chart can accommodate a maximum of 32,000 data points in a single data series.
A 3-D chart can accommodate a maximum of 32,000 data points in a single data series.
If the data orientation is incorrect, the chart can be easily adjusted using the Chart Tools Design option.
If the data orientation is incorrect, the chart can be easily adjusted using the Chart Tools Design option.
Charts created in Excel can only be made from data in the same worksheet.
Charts created in Excel can only be made from data in the same worksheet.
To create a default chart quickly in Excel, you can press F11.
To create a default chart quickly in Excel, you can press F11.
When changing the type of a chart, Excel removes all previous settings and data series.
When changing the type of a chart, Excel removes all previous settings and data series.
The first step in creating a chart is to select the data, including the column headers if applicable.
The first step in creating a chart is to select the data, including the column headers if applicable.
Flashcards are hidden until you start studying
Study Notes
Getting Started with Excel Charts
- Charts provide a visual representation of numeric values, allowing quick understanding of relationships, differences, and trends.
- Excel is capable of generating a wide variety of highly customizable charts to effectively communicate messages.
Chart Basics
- A chart (or graph) is defined as a visual representation of numeric values.
- Charts improve data comprehension and can highlight trends that may be overlooked in raw data.
How Excel Handles Charts
- Charts rely on data stored in worksheet cells, typically from a single worksheet but can span multiple.
- Charts are dynamic and automatically update when underlying data changes.
- Two types of chart locations:
- Embedded charts within a worksheet.
- Separate chart sheets.
Limitations of Excel Charts
- Number of worksheets referred by a chart: 255.
- Maximum data series in a chart: 255.
- Maximum data points in a data series: 32,000 (4,000 for 3-D charts).
- Total data points in a chart: 256,000.
Creating a Chart
- Select desired data including column headers to create a chart effectively.
- Access the Insert tab and click a Chart icon; this opens a gallery of chart types.
- Quickly create a default embedded chart using Alt+F1 or a chart on a separate sheet using F11.
Modifying Chart Orientation and Type
- Change data orientation by selecting the chart and using the Switch Row/Column command in the Chart Tools Design tab.
- Modify chart type post-creation through Chart Tools to meet presentation needs.
Moving and Copying Charts
- Move an embedded chart using the Cut and Paste commands or through the Move Chart option.
- Copy charts by selecting the chart and using Copy, then Paste as needed, ensuring the new chart remains linked to data.
Deleting Charts
- Delete an embedded chart with the Delete key or select multiple to delete at once.
- Right-click and choose Delete from the shortcut menu to remove a separate chart sheet.
Adding and Managing Chart Elements
- Add elements like titles and legends using the Chart Elements icon next to the chart.
- Chart elements can be repositioned by selection and dragging their borders; delete by selecting and pressing Delete.
Printing Charts
- Print embedded charts in the same way as worksheets; ensure the print range captures them.
- Separate chart sheets print on their own pages.
- To exclude an embedded chart from printing, access the Format Chart Area task pane and uncheck the Print Object option.
Getting Started with Excel Charts
- Charts in Excel provide a visual representation of data, helping to identify relationships, differences, and trends quickly.
- Charting is a powerful tool for effective data communication, allowing users to absorb information rapidly through graphics.
- Charts have evolved significantly since their inception, with Excel offering a wide range of customizable options.
Understanding Charts
- A chart is a graphical depiction of numeric values, also known as a graph.
- Charts summarize and simplify complex datasets, making trends and patterns more visible.
- Creating a basic column chart can be done easily by selecting relevant data, using Alt+F1 for an embedded chart.
How Excel Handles Charts
- Data for charts is typically housed within a single worksheet, but can also draw from multiple sheets or workbooks as needed.
- Charts in Excel are dynamic; any changes to the underlying data automatically update the chart.
- A chart consists of one or more data series displayed based on the chosen chart type, each represented by distinct markers or lines.
Types of Charts
- Various chart types are available; the selection can significantly affect data interpretation.
- Common types include column charts, pie charts, and line charts, each serving different data visualization needs.
- Charts can include legends and data labels for clarification, enhancing readability.
Chart Components
- Key parts of charts include the chart area (background), plot area (actual data display), axes, gridlines, and chart titles.
- Embedded charts float on top of a worksheet and can be resized and formatted like other drawing objects.
- When using multiple data series, legends help distinguish between data points.
Chart Limitations
- Excel imposes certain constraints on charts:
- Charts in a worksheet are limited by available memory.
- Up to 255 worksheets can be referenced, with a maximum of 255 data series per chart.
- Each data series can have up to 32,000 data points (4,000 for 3-D charts), and charts can collectively present a total of 256,000 data points.
Basic Steps for Creating a Chart
- Selecting the data range, including headers, is the first step in chart creation.
- Use the Insert tab to access chart icons and types, facilitating quick chart generation from selected data.
- Switching data orientation in charts can clarify presentation but may alter the chart's comprehensibility.
Customizing Charts
- After initial creation, users can change the chart type as needed for better representation.
- Additional elements like titles, legends, and gridlines can be added via the Chart Elements control.
- Chart elements can be moved or deleted easily by selecting and dragging or pressing Delete.
Printing Charts
- Printing embedded charts involves standard printing methods within Excel, ensuring charts are included in the print range.
- Charts created on a separate chart sheet print as individual pages.
- Unwanted charts can be excluded from printouts by adjusting properties in the Format Chart Area pane.
Studying That Suits You
Use AI to generate personalized quizzes and flashcards to suit your learning preferences.