Podcast
Play an AI-generated podcast conversation about this lesson
Questions and Answers
What is the purpose of using Excel charts?
What is the purpose of using Excel charts?
- To decrease data accuracy
- To hide data from viewers
- To make data more understandable visually (correct)
- To complicate data representation
Which of the following statements about charts is true?
Which of the following statements about charts is true?
- Charts do not help in data analysis
- Different charts are used for different types of data (correct)
- Charts are not customizable
- All charts can be used interchangeably for any type of data
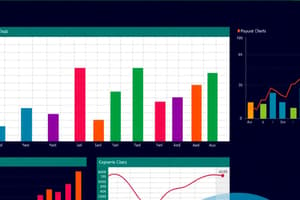
How are Charmander, Squirtle, and Bulbasaur represented in the column chart?
How are Charmander, Squirtle, and Bulbasaur represented in the column chart?
- By text labels
- By different pie slices
- By different line graphs
- By different colored bars (correct)
What do the orange bars in the chart represent?
What do the orange bars in the chart represent?
Signup and view all the answers
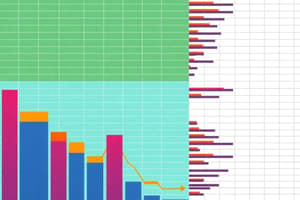
Which Pokemon has the highest defense according to the given chart?
Which Pokemon has the highest defense according to the given chart?
Signup and view all the answers