Podcast
Questions and Answers
What does a density curve estimate regarding observations?
What does a density curve estimate regarding observations?
- It indicates the standard deviation of the data.
- It predicts the exact number of observations.
- It shows the relationship between two variables.
- It estimates the proportions of observations within an interval. (correct)
What is a key characteristic of a density curve?
What is a key characteristic of a density curve?
- It must have a total area greater than 1.
- It can dip below the horizontal axis.
- It is only effective for categorical data.
- It is always on or above the horizontal axis. (correct)
How is the mean of a density curve defined?
How is the mean of a density curve defined?
- The highest point of the density curve.
- The balance point of the curve if it were solid. (correct)
- The point that divides the curve into two equal areas.
- The point where the most observations occur.
Which term describes the point that divides the area of a density curve in half?
Which term describes the point that divides the area of a density curve in half?
What feature defines a uniform density curve?
What feature defines a uniform density curve?
What can be said about the relationship between the mean and the median in a symmetrical density curve?
What can be said about the relationship between the mean and the median in a symmetrical density curve?
In a left-skewed density curve, what is the relationship between the mean and the median?
In a left-skewed density curve, what is the relationship between the mean and the median?
Which statement correctly describes the mean in relation to the median in a left-skewed distribution?
Which statement correctly describes the mean in relation to the median in a left-skewed distribution?
What will happen to the mean and median in a symmetric distribution regarding their values?
What will happen to the mean and median in a symmetric distribution regarding their values?
When comparing the means of a left-skewed and a right-skewed distribution, what can be generally concluded?
When comparing the means of a left-skewed and a right-skewed distribution, what can be generally concluded?
Flashcards are hidden until you start studying
Study Notes
Density Curve
- Represents the distribution of a quantitative variable.
- Always positioned on or above the horizontal axis.
- Area beneath the curve equals exactly 1, signifying total probability.
- The area under the curve for any interval on the horizontal axis indicates the proportion of observations within that range.
Shapes of Density Curves
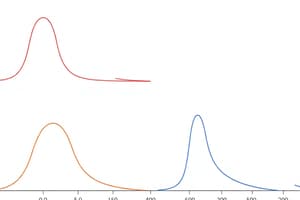
- Skewed Left, Single Peaked: Tail extends longer to the left; concentration of data on the right.
- Uniform: All intervals have equal probability; flat appearance.
- Bimodal: Two distinct peaks, indicating two prevalent values or groups within the data.
- Roughly Symmetrical, Double-Peaked: Two peaks but balances around a central midpoint, resembling symmetry.
- Skewed Right, Single Peaked: Tail extends longer to the right; concentration of data on the left.
Mean of a Density Curve
- Acts as the balancing point of the curve if it were a solid object.
Median of a Density Curve
- Divides the area under the curve into two equal halves.
- In symmetrical density curves, mean and median are equal.
- In left-skewed curves, the mean is less than the median, positioned further left.
- In right-skewed curves, the mean is greater than the median, positioned further right.
Studying That Suits You
Use AI to generate personalized quizzes and flashcards to suit your learning preferences.