Podcast
Questions and Answers
What is the mean of the standard normal distribution?
What is the mean of the standard normal distribution?
- 0 (correct)
- 1
- 2
- -1
Which tool can be used to find cumulative probabilities for normal distributions?
Which tool can be used to find cumulative probabilities for normal distributions?
- Graphing Calculator
- Word Processor
- Python Programming
- Z-Table (correct)
When using the Z-Table, what does each value in the body of the table represent?
When using the Z-Table, what does each value in the body of the table represent?
- The cumulative area from the right
- The probability of obtaining a z score
- The mean of a specific z score
- The cumulative area from the left (correct)
What is the standard deviation of the standard normal distribution?
What is the standard deviation of the standard normal distribution?
Which of the following tools does not allow for finding normal distribution probabilities?
Which of the following tools does not allow for finding normal distribution probabilities?
How is the Z-Table organized?
How is the Z-Table organized?
What command is used in Excel to find cumulative probabilities for a normal distribution?
What command is used in Excel to find cumulative probabilities for a normal distribution?
What is the primary purpose of the Z-Table?
What is the primary purpose of the Z-Table?
What is a characteristic of a density curve?
What is a characteristic of a density curve?
Which statement accurately describes the standard normal distribution?
Which statement accurately describes the standard normal distribution?
What does the total area under a density curve represent?
What does the total area under a density curve represent?
In the context of the standard normal distribution, what are the values of its mean and standard deviation?
In the context of the standard normal distribution, what are the values of its mean and standard deviation?
What does a probability density function approximate?
What does a probability density function approximate?
Which of the following options defines a continuous random variable?
Which of the following options defines a continuous random variable?
What does the graph of a normal distribution typically look like?
What does the graph of a normal distribution typically look like?
In a histogram relating to a continuous random variable, what do the heights of the bars represent?
In a histogram relating to a continuous random variable, what do the heights of the bars represent?
What does the z score measure in the context of the standard normal distribution?
What does the z score measure in the context of the standard normal distribution?
What does the value found in the body of the Z-Table represent?
What does the value found in the body of the Z-Table represent?
What is the probability that a randomly selected adult has a bone density test result below 1.27?
What is the probability that a randomly selected adult has a bone density test result below 1.27?
If z scores are normally distributed with a mean of 0 and a standard deviation of 1, what z score corresponds to a reading above -1.23?
If z scores are normally distributed with a mean of 0 and a standard deviation of 1, what z score corresponds to a reading above -1.23?
Which of the following statements about the standard normal distribution is true?
Which of the following statements about the standard normal distribution is true?
What formula can be used in Excel to find the cumulative probability for a z score of 1.27?
What formula can be used in Excel to find the cumulative probability for a z score of 1.27?
If a readability test scores follow a standard normal distribution, which of the following z scores indicates a value below average?
If a readability test scores follow a standard normal distribution, which of the following z scores indicates a value below average?
How can z scores be interpreted in the context of a bone density test?
How can z scores be interpreted in the context of a bone density test?
What shape does the graph of a normal distribution exhibit?
What shape does the graph of a normal distribution exhibit?
In a standard normal distribution, what are the values of µ and σ?
In a standard normal distribution, what are the values of µ and σ?
How is a uniform distribution described in terms of value distribution?
How is a uniform distribution described in terms of value distribution?
What does the total area under the density curve of a normal distribution represent?
What does the total area under the density curve of a normal distribution represent?
What is the probability of selecting a thermometer with a reading above -1.23 degrees?
What is the probability of selecting a thermometer with a reading above -1.23 degrees?
If a voltage level has a probability of 0.25 in a uniform distribution, what does this represent?
If a voltage level has a probability of 0.25 in a uniform distribution, what does this represent?
What is depicted by the shaded area in the example of voltage levels?
What is depicted by the shaded area in the example of voltage levels?
What is the result of P(−2.00 < z < 1.50)?
What is the result of P(−2.00 < z < 1.50)?
Which equation represents the probability density function (PDF) of a normal distribution?
Which equation represents the probability density function (PDF) of a normal distribution?
What does P(z < a) represent in standard normal distribution notation?
What does P(z < a) represent in standard normal distribution notation?
Which of the following is NOT a feature of a normal distribution?
Which of the following is NOT a feature of a normal distribution?
If P(z < 1.56) = 0.9406, what is P(z > 1.56)?
If P(z < 1.56) = 0.9406, what is P(z > 1.56)?
What is the probability of obtaining a z score less than -1.56?
What is the probability of obtaining a z score less than -1.56?
Which of the following is the correct formula to calculate P(−0.85 < z < 1.56)?
Which of the following is the correct formula to calculate P(−0.85 < z < 1.56)?
What is the probability of a z score being either less than -1.65 or greater than 1.65?
What is the probability of a z score being either less than -1.65 or greater than 1.65?
For P(z > −0.85), what is the resulting probability?
For P(z > −0.85), what is the resulting probability?
Flashcards
Continuous Random Variable
Continuous Random Variable
A continuous random variable is a variable that can take on any value within a given range.
Density Curve
Density Curve
A density curve is the graph of a continuous probability distribution. It's a smooth, unbroken curve that describes the probability of a variable taking on any given value.
Area under Density Curve
Area under Density Curve
The total area under the density curve must equal 1. This represents the fact that the probability of the variable taking on any value within its range is 1.
Standard Normal Distribution
Standard Normal Distribution
Signup and view all the flashcards
Bell-shaped Curve
Bell-shaped Curve
Signup and view all the flashcards
Mean of Standard Normal
Mean of Standard Normal
Signup and view all the flashcards
Standard Deviation of Standard Normal
Standard Deviation of Standard Normal
Signup and view all the flashcards
Applications of Standard Normal
Applications of Standard Normal
Signup and view all the flashcards
Uniform Distribution
Uniform Distribution
Signup and view all the flashcards
Uniform Distribution Graph
Uniform Distribution Graph
Signup and view all the flashcards
Normal Distribution
Normal Distribution
Signup and view all the flashcards
Area and Probability Relationship
Area and Probability Relationship
Signup and view all the flashcards
Probability and Shaded Area
Probability and Shaded Area
Signup and view all the flashcards
Area-Probability Correspondence
Area-Probability Correspondence
Signup and view all the flashcards
Z-Table
Z-Table
Signup and view all the flashcards
z-score
z-score
Signup and view all the flashcards
Area under the standard normal curve
Area under the standard normal curve
Signup and view all the flashcards
P(z < value)
P(z < value)
Signup and view all the flashcards
P(z > value)
P(z > value)
Signup and view all the flashcards
P(value1 < z < value2)
P(value1 < z < value2)
Signup and view all the flashcards
Bone Mineral Density Test
Bone Mineral Density Test
Signup and view all the flashcards
Standardization
Standardization
Signup and view all the flashcards
Finding probabilities using the standard normal distribution
Finding probabilities using the standard normal distribution
Signup and view all the flashcards
Cumulative area
Cumulative area
Signup and view all the flashcards
Using the Z-Table
Using the Z-Table
Signup and view all the flashcards
P(a < z < b)
P(a < z < b)
Signup and view all the flashcards
P(z > a)
P(z > a)
Signup and view all the flashcards
P(z < a)
P(z < a)
Signup and view all the flashcards
P(z > -1.23)
P(z > -1.23)
Signup and view all the flashcards
P(-2.00 < z < 1.50)
P(-2.00 < z < 1.50)
Signup and view all the flashcards
P(z < -2.00)
P(z < -2.00)
Signup and view all the flashcards
P(z < 1.50)
P(z < 1.50)
Signup and view all the flashcards
What is the probability of selecting a thermometer with a reading above -1.23 degrees?
What is the probability of selecting a thermometer with a reading above -1.23 degrees?
Signup and view all the flashcards
Study Notes
Chapter 6: Normal Probability Distributions
- This chapter covers normal probability distributions.
- It includes information on continuous random variables, density curves, the standard normal distribution, and applications of normal distributions.
Continuous Random Variable
- A continuous random variable, represented by x, can taken on any value within a given range.
- In this context, the heights of 5,000 female students are used as an example.
- Table 1 presents frequency and relative frequency distributions for student heights (in inches) across different ranges.
Density Curve
- A density curve visually represents a continuous probability distribution.
- Key properties: the total area under the curve equals 1; every point on the curve has a vertical height of 0 or greater (the curve cannot go below the x-axis).
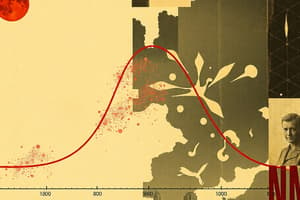
- (Figure 1) illustrates a histogram and polygon for the relative frequency distribution in Table 1. This is an approximation of the continuous probability distribution curve for the variable x.
The Standard Normal Distribution
- The standard normal distribution, denoted by Z, is a specific type of normal distribution.
- It has a mean of 0 and a standard deviation of 1, i.e. Z ~ N(0,1)
- Its graph is bell-shaped and symmetrical.
Normal Distribution
- A continuous random variable is normally distributed if its distribution is bell-shaped and symmetrical following the equation: f(x) = e^(-(x-μ)^2/(2σ^2)) / (σ√2π)
- A uniform distribution is a continuous random variable whose values are evenly spread within the range of probabilities.
Using Area to Find Probability
- The total area beneath the density curve is always equal to 1.
- This means there's a direct relationship between the area under the curve and probability.
- Example illustration: Finding the probability of a randomly chosen voltage level being above 124.5 volts, given a specific uniform distribution
Finding Probabilities when given z Scores
- Z-Table is used to calculate probabilities in normal distributions. other methods include using formulas and tools like STATDISK, Minitab, Excel, and TI/83/84 Plus.
Using Z-Table
- Z-Table is a table used to find cumulative areas under the standard normal curve. It's used to determine probabilities for different regions.
- The table provides probabilities for different z-score values. Different software packages provide the calculated values, including Excel, Minitab, and STATDISK.
Finding a z Score when given a Probability
- The process involves drawing a bell-shaped curve.
- Using the cumulative area, locating the closest probability in the Z-Table to find the corresponding z-score.
Applications of Normal Distributions
- The chapter introduces converting non-standard normal distributions to standard normal distributions using the formula Z = (x - μ) / σ, where x is the data point, μ is the mean, and σ is the standard deviation.
- This allows using the Z-table for probability calculations involving non-standard normal distributions.
- Examples involve calculating probabilities and finding specific values (e.g., weights, heights) given data characteristics.
Studying That Suits You
Use AI to generate personalized quizzes and flashcards to suit your learning preferences.