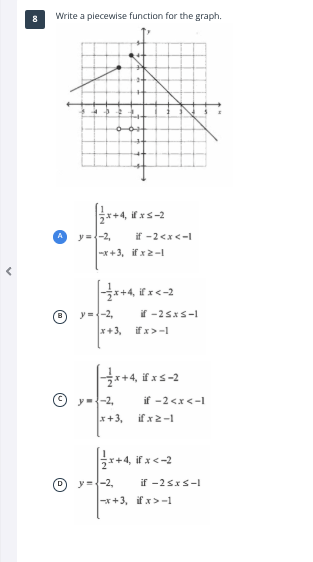
Write a piecewise function for the graph.
Understand the Problem
The question is asking for the construction of a piecewise function based on the provided graph, identifying the function's behavior over different intervals of the x-axis.
Answer
$$ y = \begin{cases} \frac{1}{2}x + 4, & \text{if } x \leq -2 \\ -2, & \text{if } -2 < x < -1 \\ x + 3, & \text{if } x \geq -1 \end{cases} $$
Answer for screen readers
$$ y = \begin{cases} \frac{1}{2}x + 4, & \text{if } x \leq -2 \ -2, & \text{if } -2 < x < -1 \ x + 3, & \text{if } x \geq -1 \end{cases} $$
Steps to Solve
-
Identify intervals on the x-axis
Examine the graph to determine different intervals based on the behavior of the graph. The key intervals are identified as:- For $x \leq -2$
- For $-2 < x < -1$
- For $x \geq -1$
-
Determine the function for each interval
Look at the graph in each identified interval:- For $x \leq -2$: The line has a slope and passes through $(−2, 2)$. Calculate the equation in this section (assuming it's linear).
- For $-2 < x < -1$: The horizontal line at $y = -2$ applies here.
- For $x \geq -1$: The line continues with a different slope and passes through $(−1, 3)$, suggesting another linear equation.
-
Finding the equations
a. For $x \leq -2$:
The equation of the line (assumed slope) may be based on the points involved.
Example based: Let’s assume it is $y = \frac{1}{2}x + 4$ (check the graph intersections).b. For $-2 < x < -1$:
This section is simply $y = -2$.c. For $x \geq -1$:
Using the slope from the point $(−1, 3)$ towards another point likely identified on the graph. Assume it was calculated as $y = x + 3$. -
Construct the piecewise function
Using the identified equations and intervals: $$ y = \begin{cases} \frac{1}{2}x + 4, & \text{if } x \leq -2 \ -2, & \text{if } -2 < x < -1 \ x + 3, & \text{if } x \geq -1 \end{cases} $$
$$ y = \begin{cases} \frac{1}{2}x + 4, & \text{if } x \leq -2 \ -2, & \text{if } -2 < x < -1 \ x + 3, & \text{if } x \geq -1 \end{cases} $$
More Information
This piecewise function describes how the behavior of the function changes based on different intervals of the input variable $x$. The function is made up of linear sections and constant values based on the graph's features.
Tips
Avoid assuming the wrong slopes or y-intercepts for the linear segments without checking with the graph points.
AI-generated content may contain errors. Please verify critical information