Write a function that models the data.
Understand the Problem
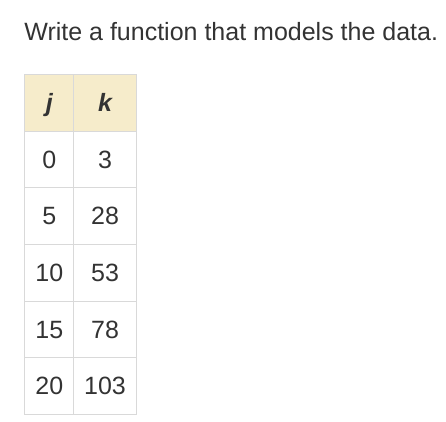
The question is asking for a mathematical function that represents the relationship between the variables j and k based on the provided data points.
Answer
The function that models the data is $k = 5j + 3$.
Answer for screen readers
The function that models the data is
$$ k = 5j + 3 $$
Steps to Solve
- Identify the relationship type
Given the data points, we can observe that as $j$ increases, $k$ also increases. This suggests a linear relationship.
- Calculate the slope of the line
To find the slope ($m$), we can use the formula:
$$ m = \frac{y_2 - y_1}{x_2 - x_1} $$
Choosing two points, for example, $(0, 3)$ and $(5, 28)$:
$$ m = \frac{28 - 3}{5 - 0} = \frac{25}{5} = 5 $$
- Use the slope-intercept form
The equation of a line can be expressed as
$$ k = mx + b $$
Substituting the slope $m = 5$, we have:
$$ k = 5j + b $$
- Determine the y-intercept ($b$)
We can use one of the points to find $b$. Using the point $(0, 3)$:
$$ 3 = 5(0) + b \implies b = 3 $$
- Write the final function
Now that we have both $m$ and $b$, we substitute them into the equation:
$$ k = 5j + 3 $$
The function that models the data is
$$ k = 5j + 3 $$
More Information
This model indicates that for every increase of 1 in $j$, $k$ increases by 5, starting from a base value of 3 when $j$ is 0.
Tips
- Miscalculating the slope by not selecting the correct pairs of points.
- Forgetting to use the correct labels for the axes in the equation.
AI-generated content may contain errors. Please verify critical information