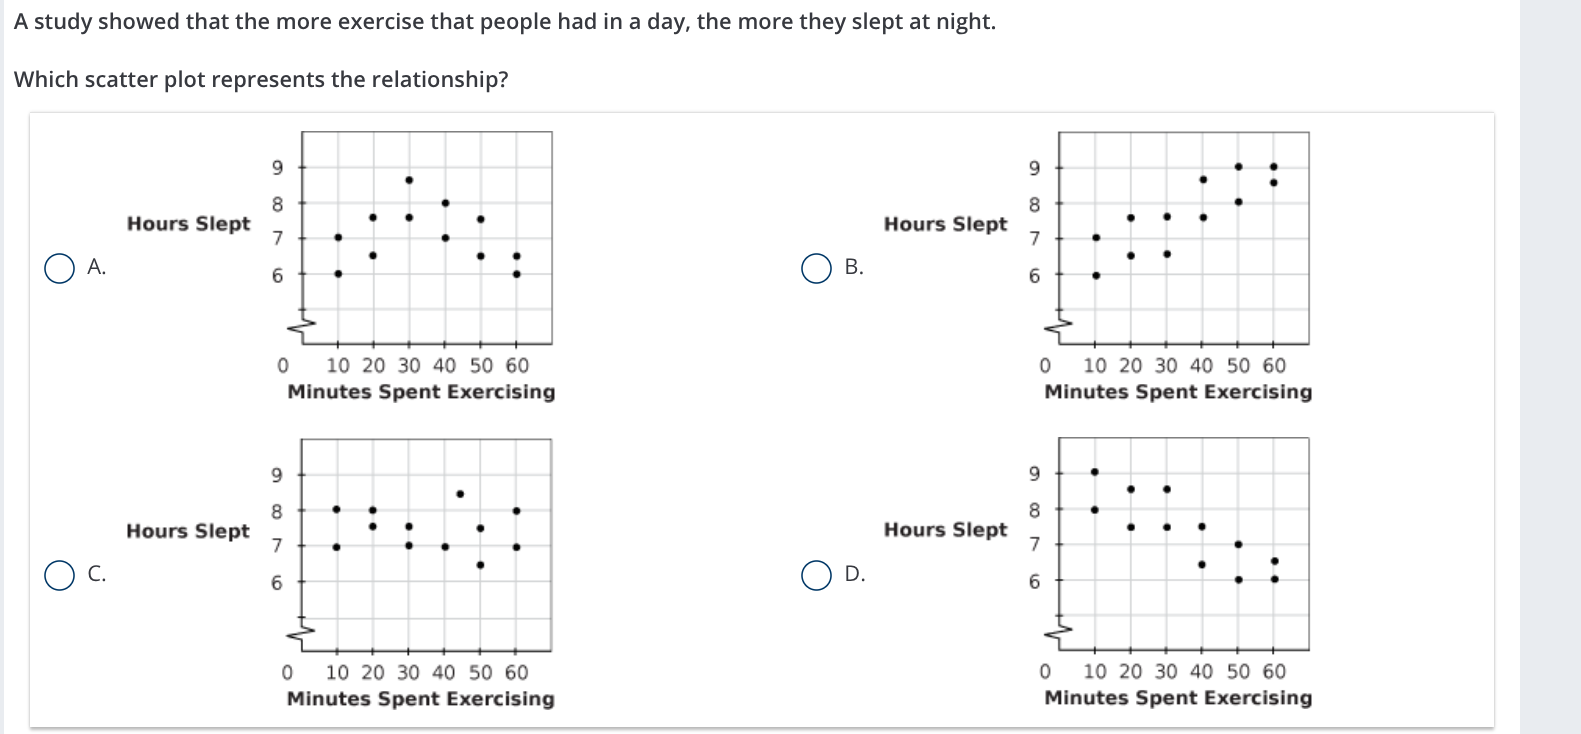
Which scatter plot represents the relationship between exercise and sleep hours?
Understand the Problem
The question is asking which scatter plot correctly represents the relationship between exercise and sleep hours, based on the information that more exercise correlates with more sleep.
Answer
B
Answer for screen readers
The correct scatter plot is B.
Steps to Solve
-
Identify the relationship
The question indicates that more exercise correlates with more sleep. This suggests a positive correlation, meaning as one variable increases, the other does as well. -
Examine the scatter plots
Look at each scatter plot to determine which shows an upwards trend (where hours slept increases with minutes spent exercising). -
Check for a positive slope
For the positive correlation we are looking for, the points should trend upwards from left to right in the scatter plot. Any downward or flat trends would indicate no correlation or negative correlation. -
Identify the correct plot
Out of the given options (A, B, C, and D), select the one that accurately represents the positive correlation as outlined.
The correct scatter plot is B.
More Information
In scatter plot B, there is a clear upward trend where more minutes spent exercising leads to more hours slept, aligning with the study's findings.
Tips
- Confusing upward trends with downward or flat trends. Ensure to look for distinct slopes in the scatter plots.
- Misreading the axes can lead to incorrect interpretations. Always check the titles of the axes to understand what each axis represents.
AI-generated content may contain errors. Please verify critical information