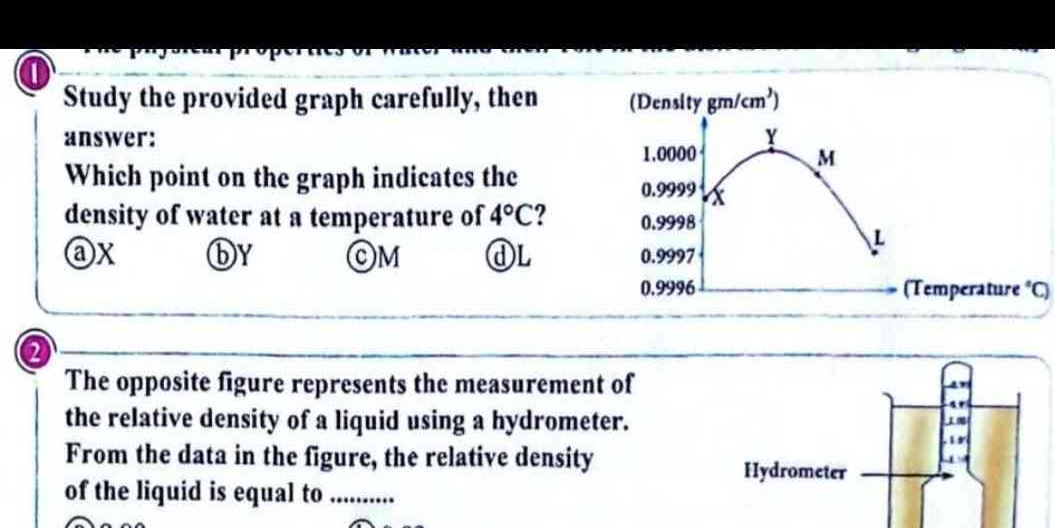
Which point on the graph indicates the density of water at a temperature of 4°C?

Understand the Problem
The question is asking to identify which point (X, Y, M, or L) on a provided graph represents the density of water at a temperature of 4°C. This involves interpreting a density vs. temperature graph to find the correct value at that specific temperature.
Answer
Point Y
The point on the graph indicating the density of water at a temperature of 4°C is point Y.
Answer for screen readers
The point on the graph indicating the density of water at a temperature of 4°C is point Y.
More Information
Water has its maximum density at 4°C, approximately 1.000 g/cm³. On the graph, this is shown at the peak point, indicating maximum density.
Tips
A common mistake is confusing the direction of the curve and selecting points to the left or right of the peak.
Sources
- Thermal Expansion and Density | EARTH 111: Water - Penn State - e-education.psu.edu
AI-generated content may contain errors. Please verify critical information