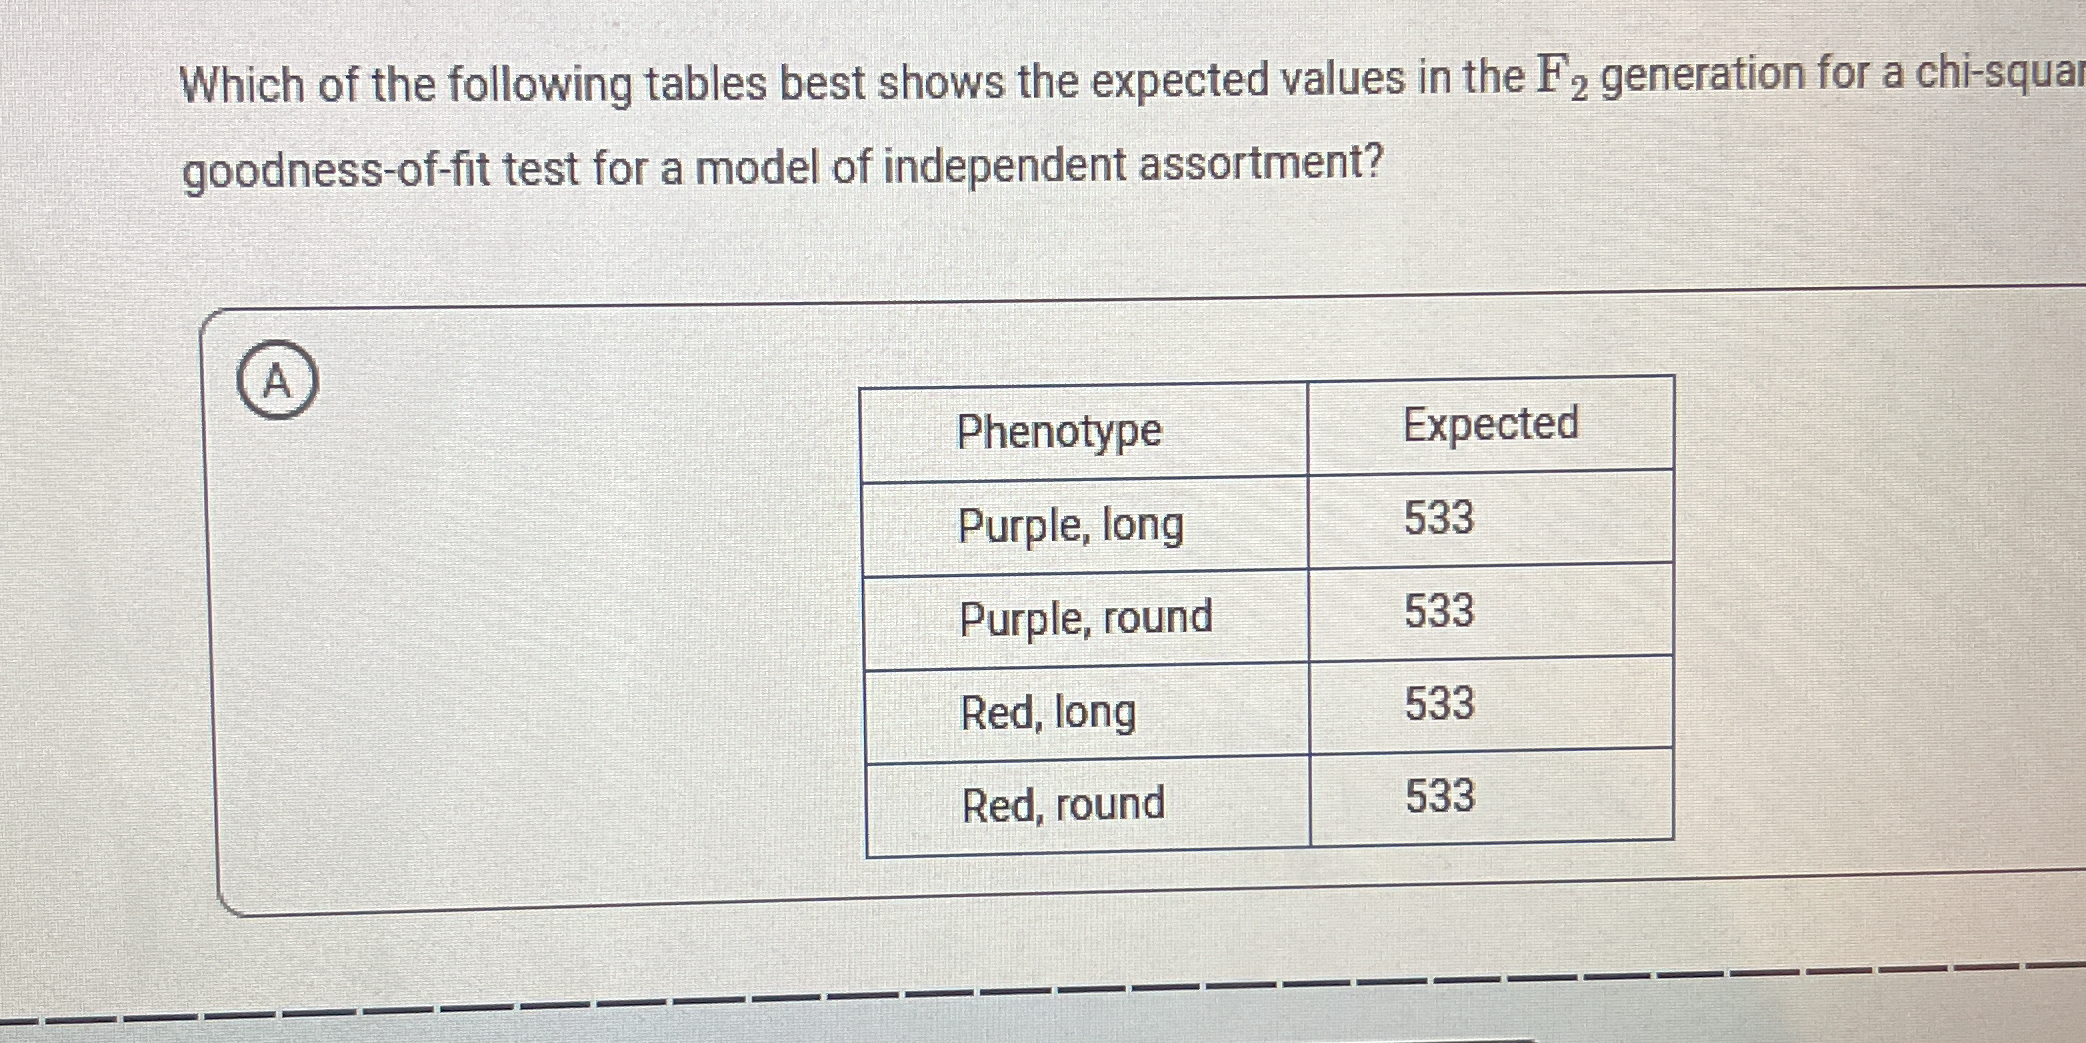
Which of the following tables best shows the expected values in the F2 generation for a chi-square goodness-of-fit test for a model of independent assortment?

Understand the Problem
The question is asking which table provides the expected values for the F2 generation in a chi-square goodness-of-fit test, specifically related to a genetic model of independent assortment. The user is looking for the correct representation of phenotypic ratios and their expected counts.
Answer
The table suggests a 1:1:1:1 ratio, not 9:3:3:1.
The table does not correctly represent a typical chi-square test for independent assortment due to the equal expected values, which suggest a 1:1:1:1 ratio rather than the expected 9:3:3:1 ratio in this context.
Answer for screen readers
The table does not correctly represent a typical chi-square test for independent assortment due to the equal expected values, which suggest a 1:1:1:1 ratio rather than the expected 9:3:3:1 ratio in this context.
More Information
In Mendelian genetics, dihybrid crosses showing independent assortment will follow a 9:3:3:1 phenotypic ratio, not equal expected values.
Tips
Avoid assuming equal expected values for a dihybrid cross chi-square test without considering the correct phenotypic ratio.
AI-generated content may contain errors. Please verify critical information