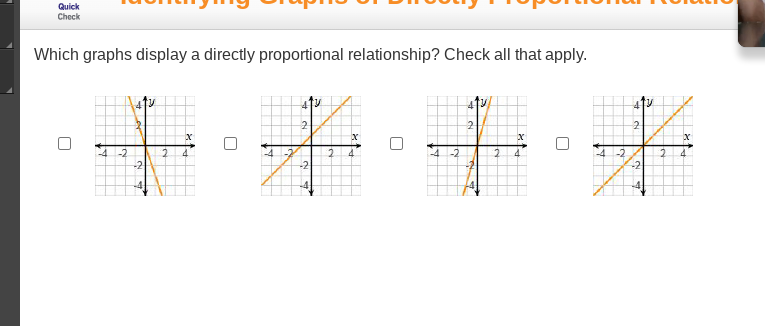
Which graphs display a directly proportional relationship? Check all that apply.

Understand the Problem
The question is asking which of the provided graphs represent a directly proportional relationship. A directly proportional relationship is characterized by a straight line that passes through the origin. We need to analyze each graph to determine if they meet this criterion.
Answer
Graphs 1 and 3 represent a directly proportional relationship.
Answer for screen readers
The graphs that display a directly proportional relationship are Graph 1 and Graph 3.
Steps to Solve
- Identify Characteristics of Directly Proportional Relationships
A directly proportional relationship is represented by a straight line that goes through the origin (0,0). This means that if you plot the values, as one variable increases, the other variable also increases linearly.
- Analyze Each Graph
- Graph 1: Check if it is a straight line and passes through the origin.
- Graph 2: Similar to Graph 1, assess if it is straight and intersects at (0,0).
- Graph 3: Apply the same criteria.
- Graph 4: Evaluate to see if it meets the direct proportionality condition.
- Conclusion on Proportionality
Determine which graphs meet the criteria by identifying if they are straight lines passing through the origin.
The graphs that display a directly proportional relationship are Graph 1 and Graph 3.
More Information
In graphs showing directly proportional relationships, as one variable doubles, the other variable also doubles, reflecting a constant ratio. If a graph does not pass through the origin or isn’t straight, it is not directly proportional.
Tips
- Failing to check if the line passes through the origin, which is a key characteristic of directly proportional relationships.
- Confusing curved lines or lines that have negative slopes with directly proportional relationships; these do not meet the criteria.
AI-generated content may contain errors. Please verify critical information